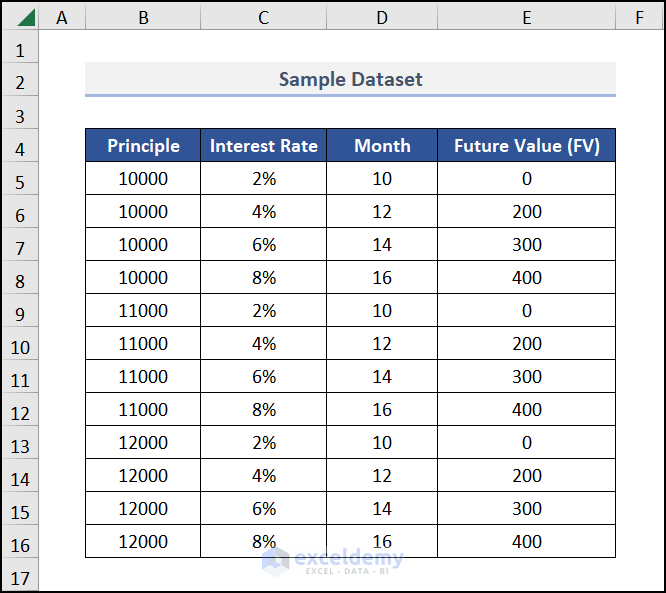
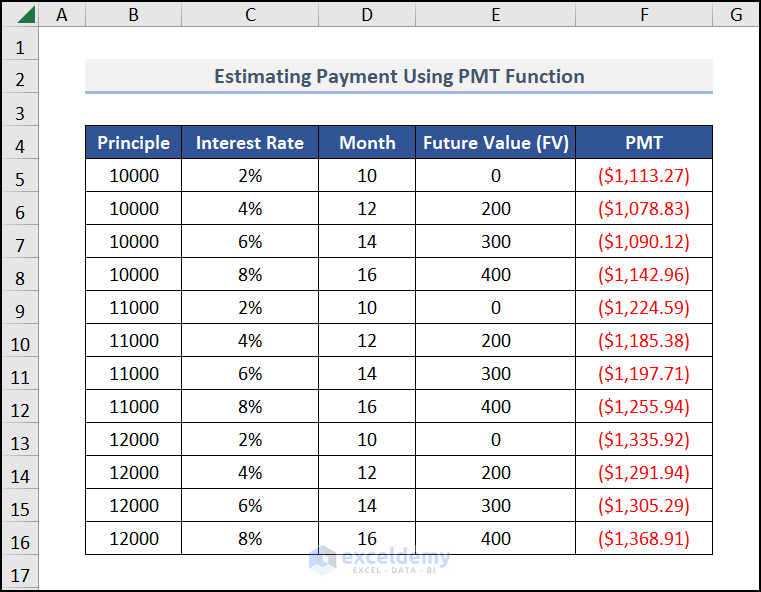
Four variables mean the dataset needs to have 4 independent variables. We will calculate the final output, which is a dependent variable. We have a dataset of Bank statements, where we entered the Principle, Interest Rate, Month, and Future Value (FV). We’ll find the Payment from these four variables.
Step 1 – Create the Outline of a Table
- Create a dataset as in the image below, with four columns for independent variables and a fifth for the dependent one.
- Fill in the independent variables for all data points.
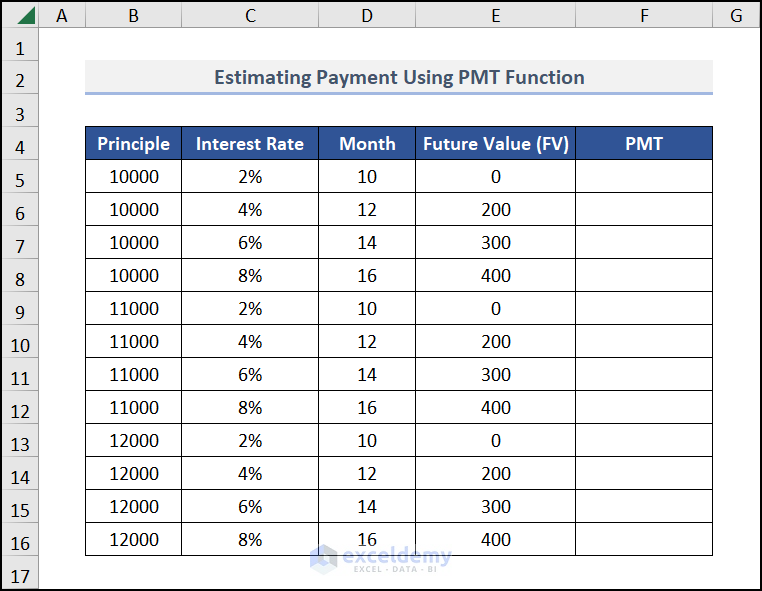
Step 2 – Calculate the Payment Using the PMT Function
- Go to cell F5 and insert the following formula.
=PMT(C5,D5,B5,E5)C5 is the Interest rate, D5 is the Month, B5 represents the Principle (Present Value), and E5 is the Future Value (FV). The PMT function returns the payment for the inserted data.
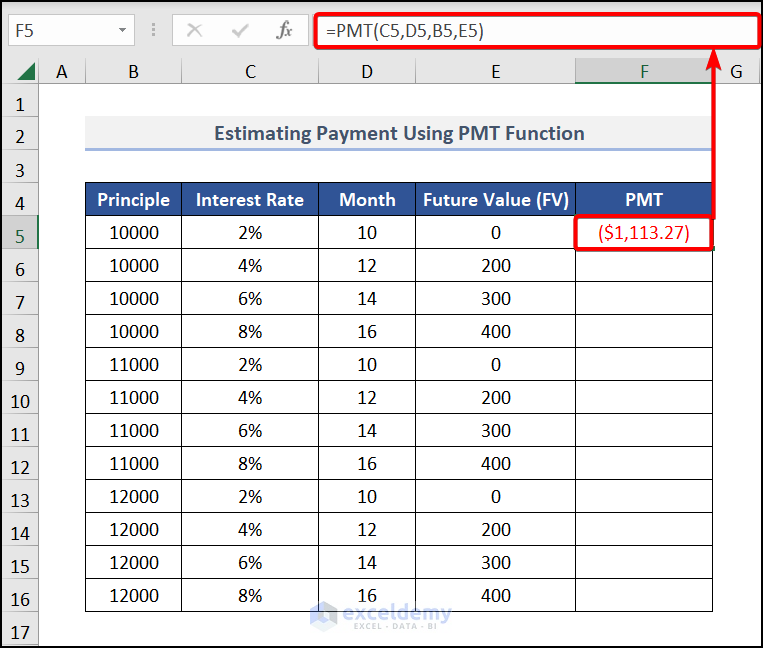
- Press Enter and drag down the Fill Handle tool for the other cells.
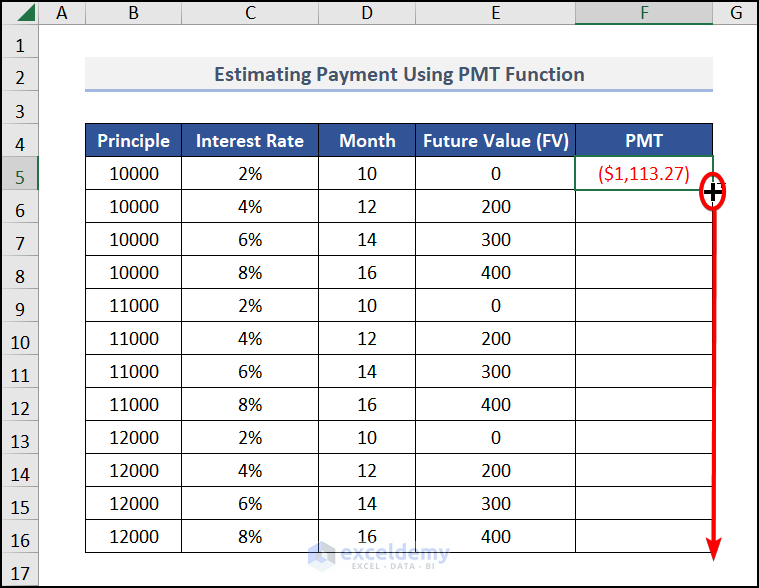
You will get all the output for the remaining cells.
Step 3 – Insert a Pivot Table
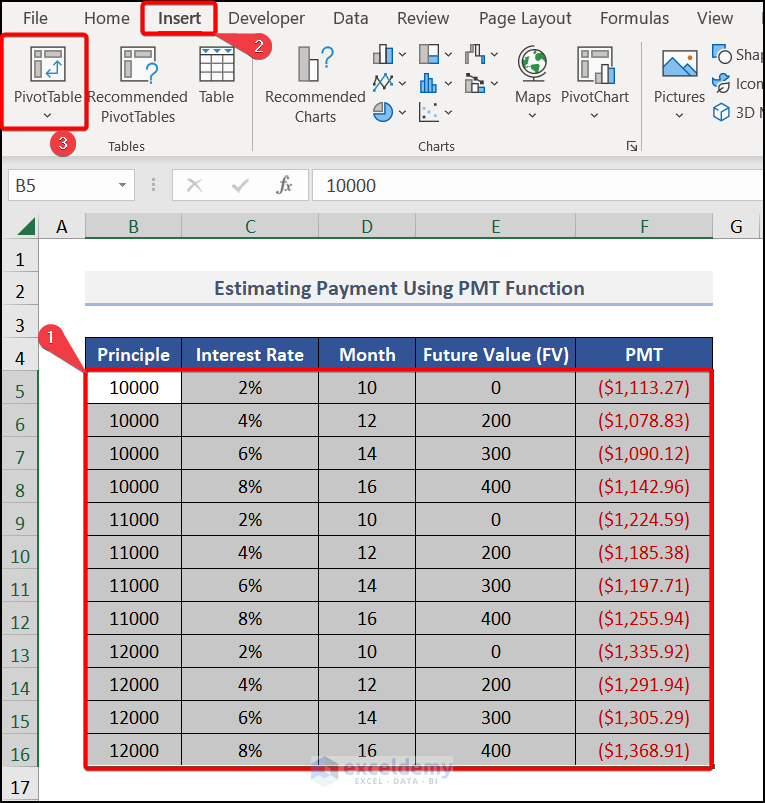
- Select the entire range B5:F16 and navigate to the Insert tab, then choose PivotTable.
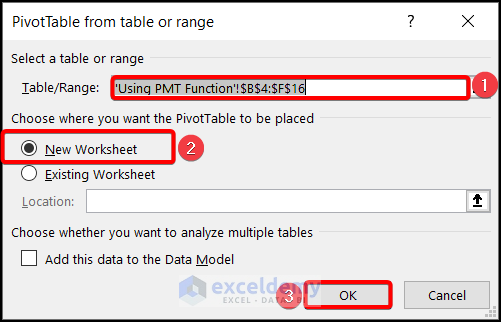
- The PivotTable from table or range window appears.
- The Table/Range is auto-selected.
- Choose New worksheet in the Choose where you want the PivotTable to be placed.
- Hit OK.
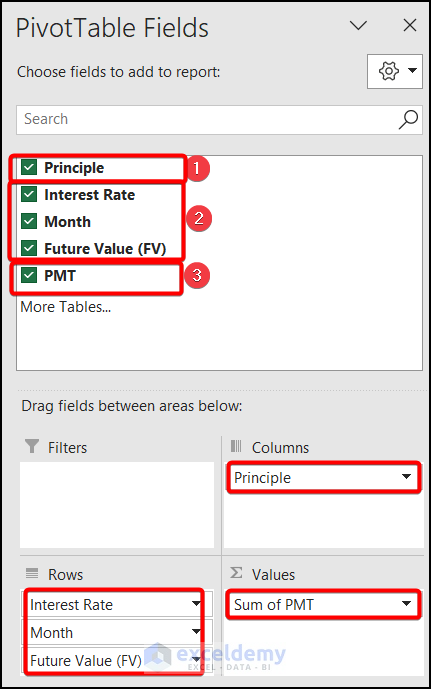
- Drag Principle in the Columns group, Interest Rate, Month, and Future Value (FV) in the Rows section, and the PMT in the ∑ Values field.
Step 4 – Modify the Data Table
- Go to the Design tab.
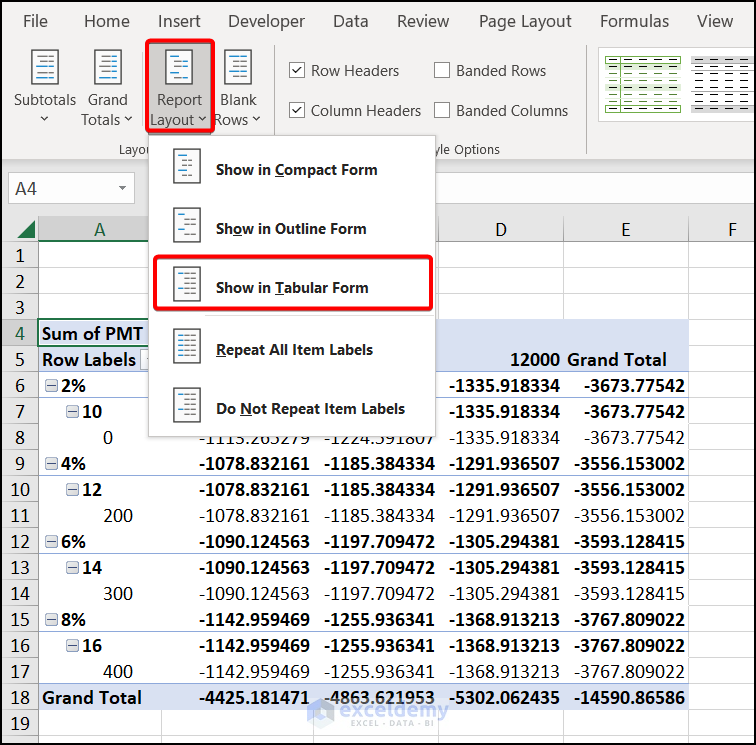
- Choose Report Layout in the Layouts group and pick Show in Tabular Form.
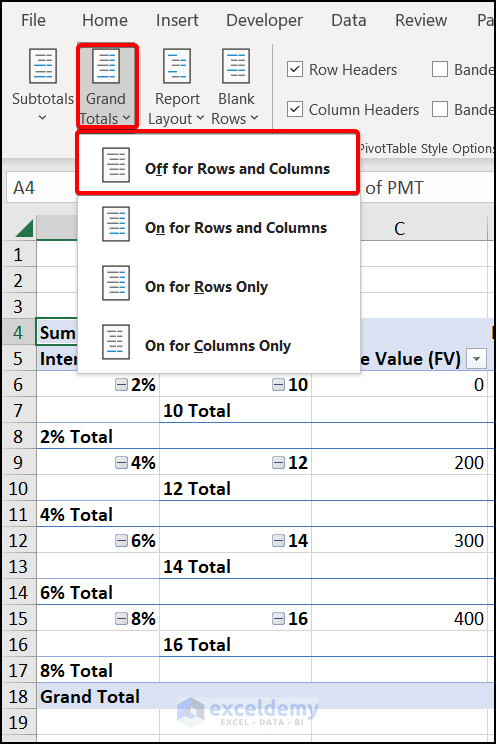
- Under the Layouts section, choose Grand Totals and select Off for Rows and Columns.
- Select Subtotals and pick Do Not Show Subtotals.
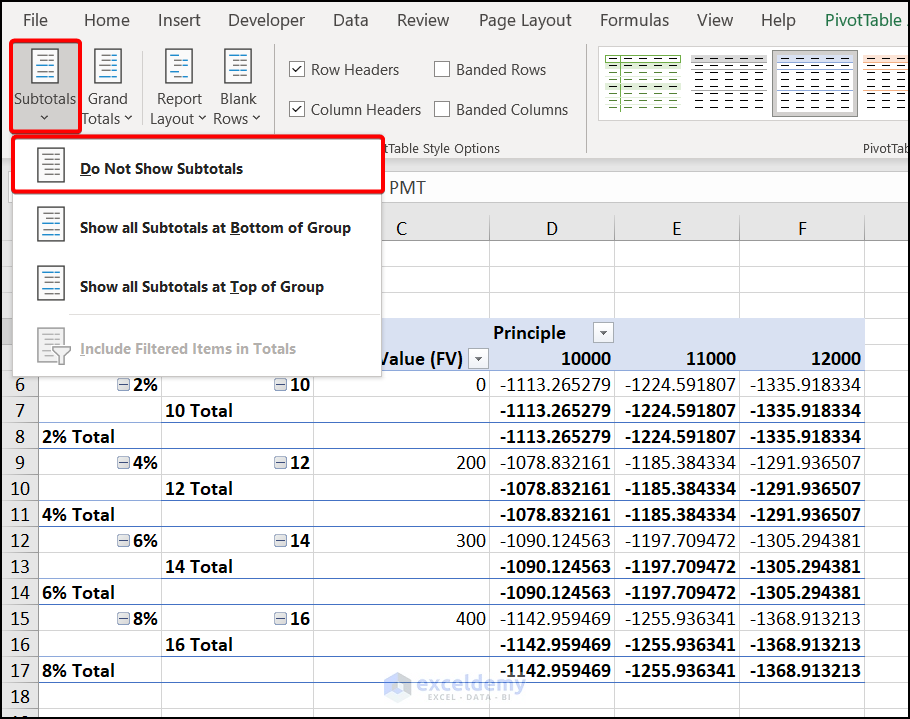
- The data table is almost ready.
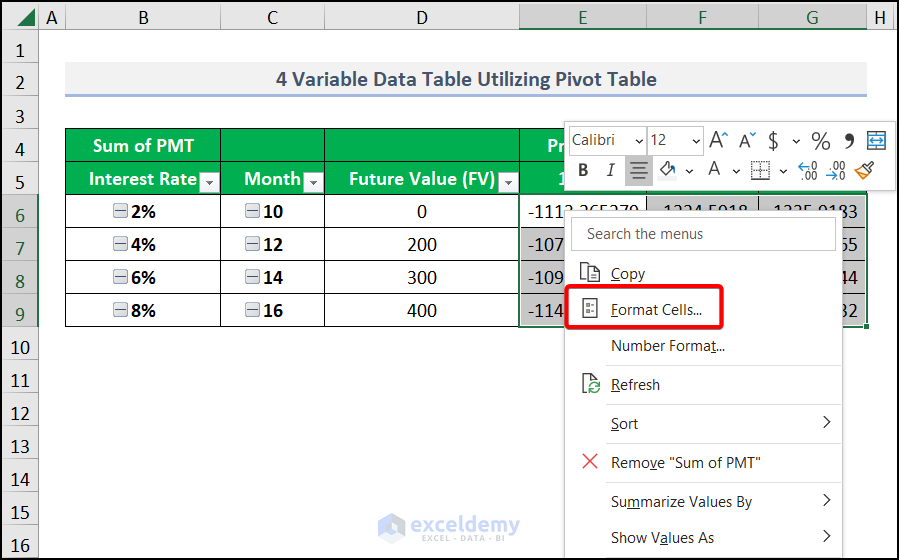
- Select the output of columns E, F, and G, right-click on the selection, then choose Format Cells.
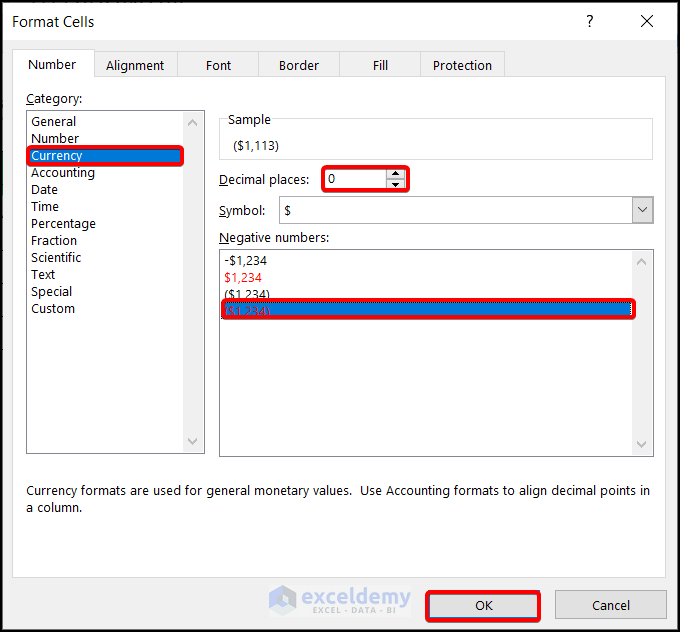
- The Format Cells window appears.
- Set the Category as Currency. Choose suitable Negative numbers and put the Decimal places as 0.
- Hit OK.
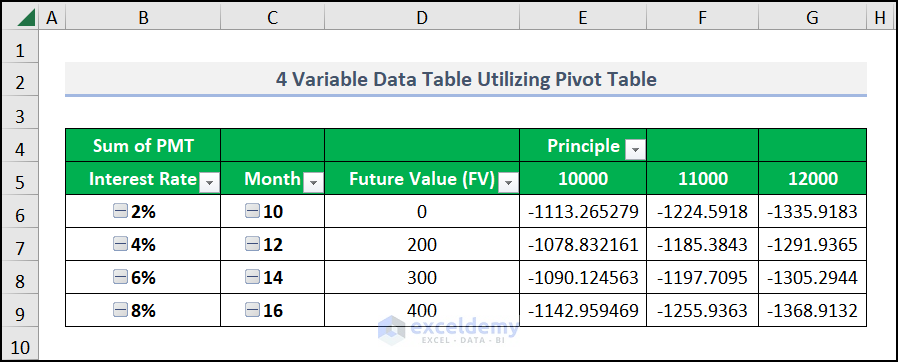
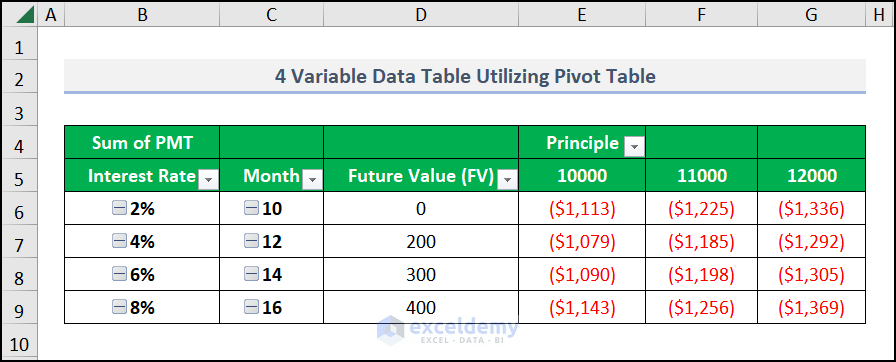
- Here’s a 4-variable data table from our sample.
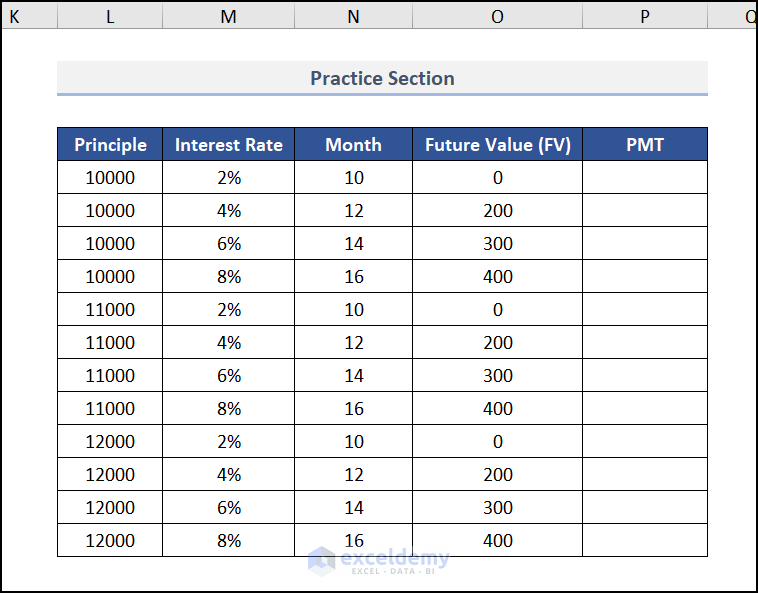
Practice Section
We have provided a practice section on each sheet on the right side for your practice.
Download the Practice Workbook
Related Articles
- How to Create One Variable Data Table in Excel
- How to Create One Variable Data Table Using What-If Analysis
- How to Create a Two-Variable Data Table in Excel
- How to Create Data Table with 3 Variables
<< Go Back to Data Table in Excel | What-If Analysis in Excel | Learn Excel
Get FREE Advanced Excel Exercises with Solutions!

