What Is Mean?
The average of a group of values is known as the mean. It refers to a data set’s values being distributed evenly. Generally, the mean measures the central tendency of a probability distribution along the median and mode in statistics.
What Is Standard Deviation?
Generally, the standard deviation in statistics measures the amount of variation or distribution in a set of numbers. If the value of standard deviation is low it means that the values are close to the mean value. On the other hand, if the value of standard deviation is high it means the values are distributed in a larger range.
Generate Random Number with Mean and Standard Deviation in Excel: 4 Ways
Method 1 – Insert NORM.INV and RAND Functions to Create Random Numbers in Excel with the Mean and Standard Deviation
The NORM.INV function returns the opposite of the normal cumulative distribution for the given Mean and Standard Deviation.
In the following dataset, we have the values of Mean and Standard Deviation. Based on these values we will create random numbers in cells (B5:B10).
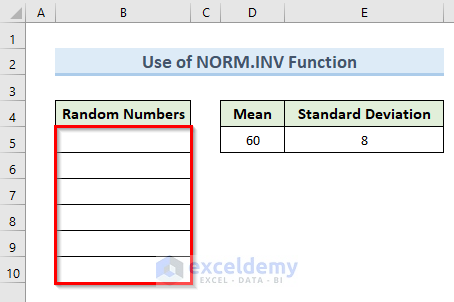
Steps:
- Select cell B5.
- Use the following formula in that cell:
=NORM.INV(RAND(),$D$5,$E$5)- Press Enter.
- Drag the Fill Handle tool from cell B5 to B10.
- We get random numbers in cells (B5:B10) based on the value of Mean and Standard Deviation.
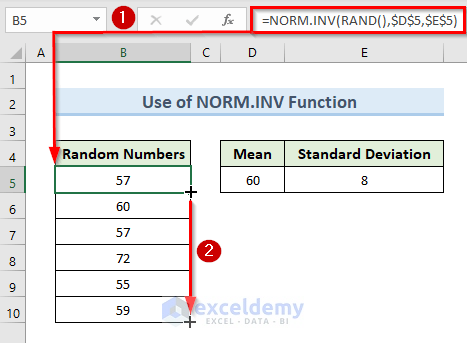
- Every time the worksheet is calculated or opened, the NORM.INV function method returns a new random number. So, you might not get the same result as our example dataset.
Method 2 – Apply the NORM.DIST Function to Generate Random Numbers with the Mean and Standard Deviation
The NORM.DIST function belongs to statistical functions. For a given set of conditions, it will calculate the normal probability density function or the cumulative normal distribution function. We’ll use a similar dataset as before.
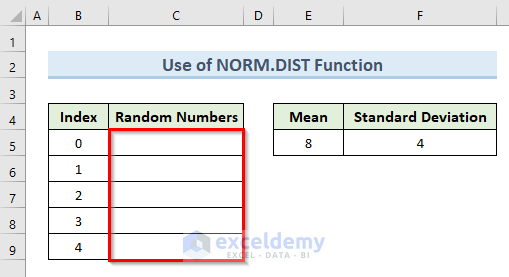
Steps:
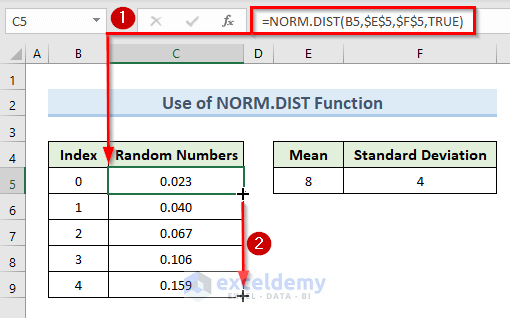
- Click on cell C5.
- Insert the following formula in that cell:
=NORM.DIST(B5,$E$5,$F$5,TRUE)- Hit Enter.
- Drag the Fill Handle tool from cell C5 to C10.
- We can see random numbers generated in cells (C5:C10).
Method 3 – Get Random Numbers with a Mean and Standard Deviation Using the RANDBETWEEN Function
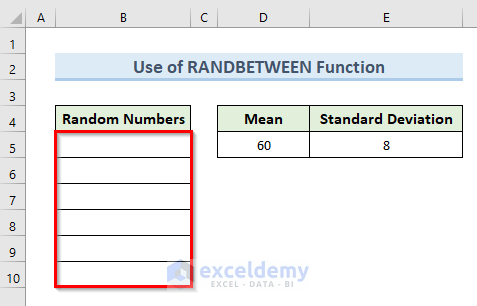
The RANDBETWEEN function in Excel generates a random number between two specific values.
Steps:
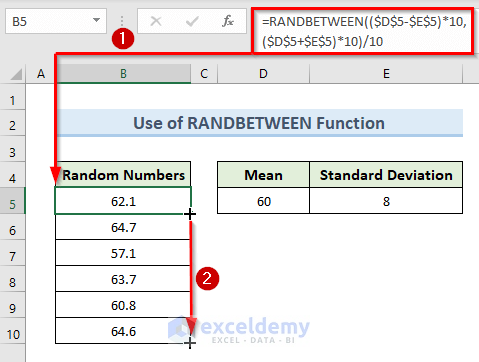
- Select cell B5.
- Copy the following formula in that cell:
=RANDBETWEEN(($D$5-$E$5)*10,($D$5+$E$5)*10)/10- Press Enter.
- To get the random numbers in other cells, drag the Fill Handle tool from cell B5 to B10.
- We get a result like the following image.
Method 4 – Use the Box Muller Method for Creating Random Numbers with a Mean and Standard Deviation in Excel
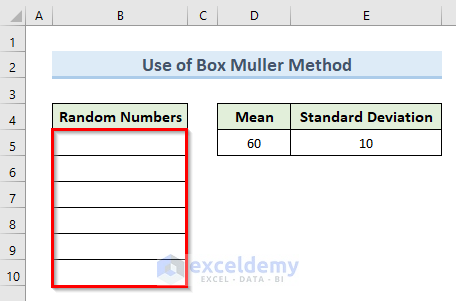
We’ll start with an empty dataset and a listed mean and standard deviation.
Steps:
- Select cell B5.
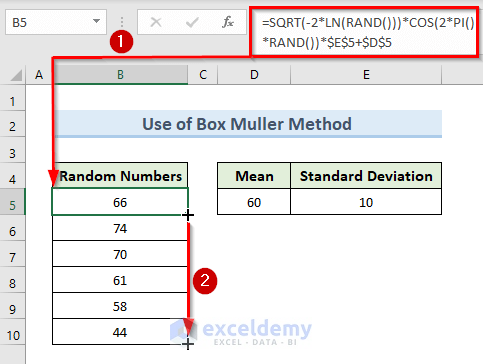
- Insert the following formula in cell B5:
=SQRT(-2*LN(RAND()))*COS(2*PI()*RAND())*$E$5+$D$5- Hit Enter.
- Drag the Fill Handle tool from cell B5 to B10 to generate all the random numbers.
- We can see the result in the following image.
How Does the Formula Work?
- RAND(): The RAND function generates random numbers.
- LN(RAND(): The LN function converts the return value of the RAND function into a natural logarithm.
- COS(2*PI()*RAND()): Returns the cosine value of 2*PI()*RAND().
- SQRT(-2*LN(RAND()))*COS(2*PI()*RAND())*$E$5+$D$5: Here, the SQRT function returns random numbers.
Download the Practice Workbook
Conclusion
In conclusion, this tutorial will show different ways to generate a random number with Mean and Standard Deviation in Excel. Use the practice worksheet that comes with this article to put your skills to the test. If you have any questions, please leave a comment below. Our team will try our best to respond to you as quickly as possible. Keep an eye out for more creative Microsoft Excel solutions in the future.
<< Go Back to Random Number in Excel | Randomize in Excel | Learn Excel
Get FREE Advanced Excel Exercises with Solutions!

