What Is Inventory Tracking?
Inventory tracking involves monitoring and managing a company’s inventory levels, movements, and status. The primary goals of inventory tracking are:
- Ensure Availability: To make sure the right products are available when needed to meet customer demand.
- Cost Optimization: Minimize costs associated with overstocking (holding excess inventory) and stockouts (running out of stock).
The common parameters used in inventory tracking include:
- Opening Stock: The initial inventory level at the beginning of a specific period (e.g., month, quarter, year).
- New Purchases: The quantity of items purchased during the period.
- Sales: The quantity of items sold during the period.
- Stock-in-Hand: The remaining inventory at the end of the period.
Here is an overview image of inventory tracking in Excel.
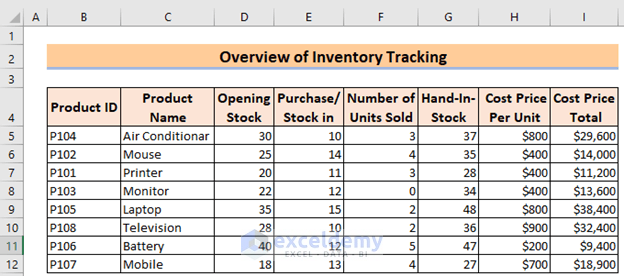
Dataset Overview
We’ll use the below sample dataset.
![]()
There are multiple sheets (Item, Stock In, Stock Out) in this Excel file. I will extract the required values from respective sheets and track inventories in the Tracker sheet.
Step 1 – Measure Opening Stock
Opening Stock refers to the quantity of a particular product that a business has in stock at the beginning of an accounting period. It serves as the starting point for tracking inventory levels throughout that period.
- In your Excel workbook, create a table listing all the items you want to track. Include a column for the opening stock quantity.
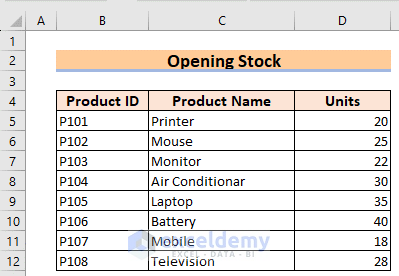
- Select the entire table.
- Give this table a name (e.g., Item).
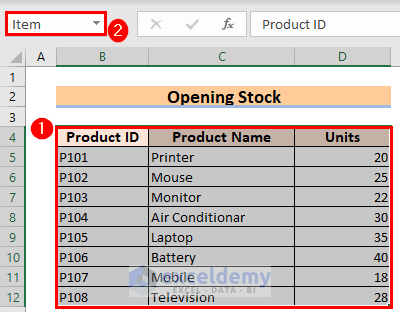
- In the Tracker sheet, where you want to track inventory, enter the following formula in cell D5 (assuming the item code is in cell B5):
=VLOOKUP(B5,Item,3,FALSE)-
- The lookup_value (B5) corresponds to the item code. Excel will search for this code in the “Item” table and return the corresponding opening stock value from the 3rd column of the table. The FALSE argument ensures an exact match.
- Drag the fill handle (small square at the bottom-right corner of the cell) down to fill the formula for all items (up to D12).
![]()
Step 2 – Calculate New Purchases
New Purchases represent the quantity of a particular product that a business acquires from suppliers during the accounting period.
- Set up a new sheet or table specifically for recording new purchases.
- Include columns for the date, item, and quantity purchased.
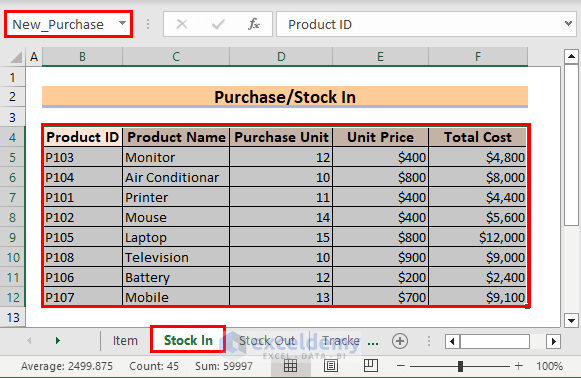
- In the Tracker sheet, enter the following formula in cell E5 (assuming the item code is in cell B5):
=VLOOKUP(B5,New_Purchase,3,FALSE)-
- Similar to before, Excel will search for the item code in the New_Purchase table and return the corresponding quantity purchased from the 3rd column.
![]()
- Drag the fill handle down to fill the formula for all items (up to E12).
Step 3 – Record Sales
Sales refer to the quantity of a particular product that a business sells to customers during the accounting period. To track sales:
- Set up a new sheet or table specifically for recording sales.
- Include columns for the date, item, and quantity sold.
- Name this table Sales.
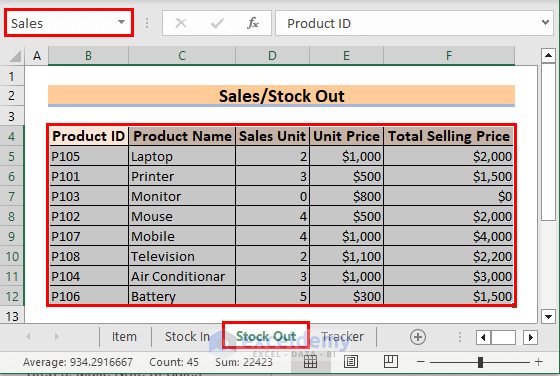
- In the Tracker sheet, enter the following formula in cell F5 (assuming the item code is in cell B5):
=VLOOKUP(B5,Sales,3,FALSE)- Excel will search for the item code (B5) in the Sales table and return the corresponding quantity sold from the 3rd column.
![]()
- AutoFill this formula down to F12.
Step 4 – Track Inventory for Different Items
Now let’s calculate the inventory for different items. This represents the quantity of a particular product that a business has in stock at the end of an accounting period.
- In cell G5 of the Tracker sheet, enter the following formula:
=D5+E5-F5
-
- This formula adds the opening stock (D5) to new purchases (E5) and subtracts sales (F5).
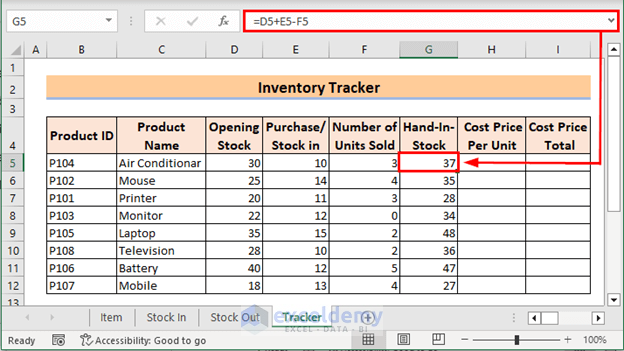
- AutoFill this formula down to G12.
Step 5 – Calculate Inventory Amount
Finally, let’s determine the inventory amount. To do this
- Create a separate list with the cost per unit for each item.
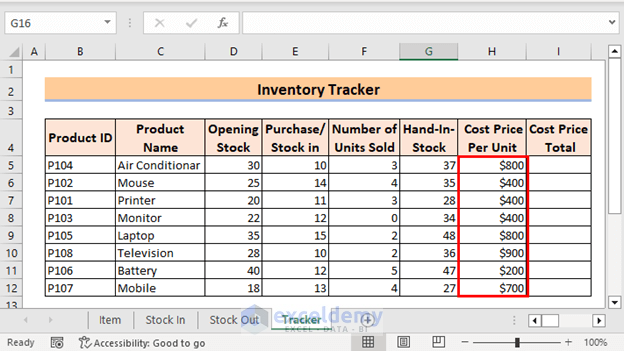
- In cell I5 of the Tracker sheet, enter the following formula:
=G5*H5
-
- This formula multiplies the hand-in-stock value (G5) by the cost per unit (H5).
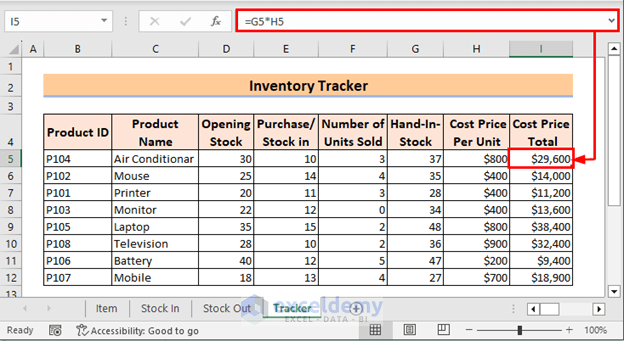
- AutoFill this formula down to I12.
Read More: How to Maintain Store Inventory in Excel
Frequently Asked Questions
- What is Inventory?
- Answer: Inventory refers to the stock of goods or materials that a business holds for eventual resale or use in production. It encompasses finished goods, work-in-progress (partially completed goods), and raw materials.
- Importance: Inventory plays a critical role in business operations by enabling companies to meet customer demand, prevent stockouts, and maintain a continuous production flow. However, managing inventory involves balancing the cost of holding it against the benefits of availability.
- Differences Between Manufacturing and Merchandising Industry Inventories:
- Answer: The primary distinction lies in the nature of their inventory.
- Manufacturing Industry Inventory:
- Includes raw materials, work-in-progress (WIP), and finished goods used in production.
- Raw materials serve as inputs for creating the final product.
- WIP represents partially completed products still in the manufacturing process.
- Finished goods are ready for sale.
- Merchandising Industry Inventory:
- Comprises finished goods purchased from suppliers and resold to customers.
- Merchandising businesses do not engage in production; their inventory is limited to purchased and resold products.
- Manufacturing Industry Inventory:
- Answer: The primary distinction lies in the nature of their inventory.
Download Practice Workbook
You can download the practice workbook from here:
Related Articles
- How to Make Inventory Aging Report in Excel
- How to Create Inventory Database in Excel
- Min Max Inventory Calculation in Excel
- How to Calculate Economic Order Quantity in Excel
- How to Calculate Stock to Sales Ratio Using Formula in Excel
<< Go Back to Inventory Management in Excel | Learn Excel
Get FREE Advanced Excel Exercises with Solutions!-


Hi. This is an excellent reference page, thank you. However, in the “Current status” page section, it only totals the number of sales. It does not show how much stock is on hand, which is what I thought it would do.
Is there a way in the current status page to show the current stock levels of various items, based on what has been purchased and what has been sold in the other sections? I was hoping to be able to have a row/column for each item that shows that information.
Hi STEWART SPEEDIE
Thank you for your insightful comment. We have just updated this article. The inventory tracker now includes the hand-in stocks. I hope this satisfies you.
Have a good day!!
I can’t thank you enough for this tutorial. It took me three days to figure it all out (my lack of Excel knowledge) – but it’s done!!! I can’t wait to start populating the fields with real information!!!!!
Dear Daniela Vognar,
You are most welcome.
Regards
ExcelDemy
This does not appear to work if your Sales table has the same product listed more than once but was sold on different dates. For example: Monitors were sold on 1/1/24, 1/5/24 and 1/30/24. How do we adjust the formula so that the lookup is looking for (let’s say) all monitors sold vs, just returning the first one it finds. Thanks!
Hello TeresaT,
You are most welcome. To adjust the formula for looking up multiple instances of the same product, try using FILTER with a lookup. For example:
=FILTER(SalesTable[Sales Date], SalesTable[Product] = “Monitor”)
This will return all sales dates for “Monitor” instead of just the first match. If you want to list all matches dynamically, you can also add an array formula to pull all relevant sales data across multiple rows. Let me know if you need further customization!
Regards
ExcelDemy