Dataset Overview
In Excel, we often work with various data and perform different operations within our worksheets. One useful feature is the Stocks Data Type, which allows you to retrieve stock information for specific companies directly in Excel.
To illustrate, we’ll use a dataset that represents multiple Companies, and their Stock Symbols (Ticker).
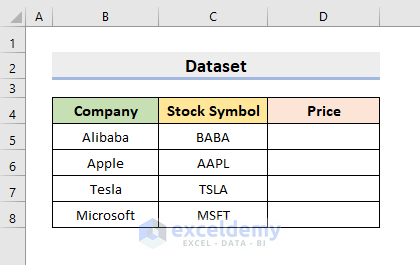
Method 1 – Using the Built-in Stocks Data Feature
STEPS
- Open your Excel workbook.
- Go to the File menu and select Options.
- In the Excel Options dialog box, navigate to the Customize Ribbon tab.
- Under the Data section, add the Data Types option to your ribbon.
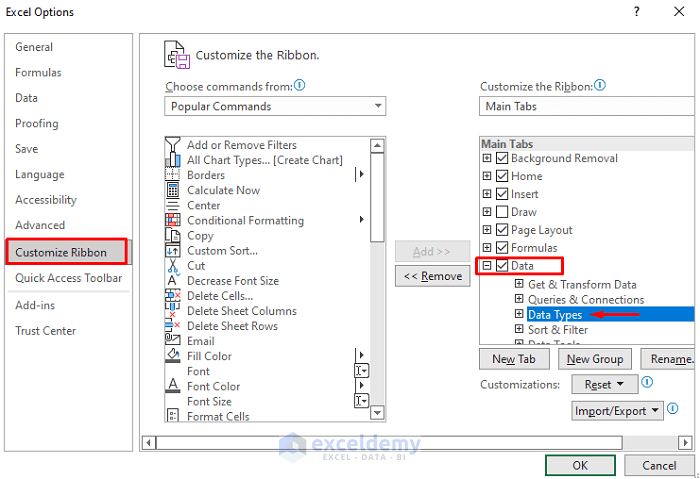
- Click OK to save your changes.
- Select the range of cells (e.g., C5:C8) where you want to add stock data.
- From the Data tab, choose Stocks.

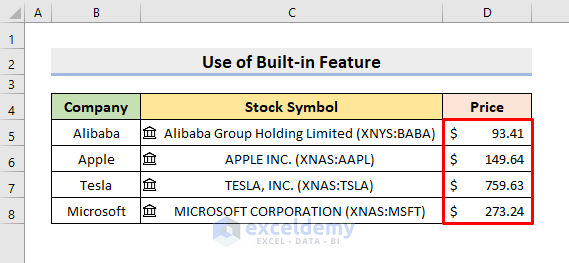
- Excel will automatically convert the stock symbols in the selected range into stock data.
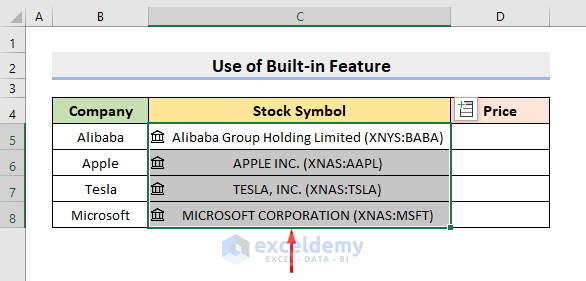
- To retrieve additional information, select the same range (C5:C8) and look for the Insert Data icon.
- Choose the desired field (e.g., Price) to display the stock prices in the next column.
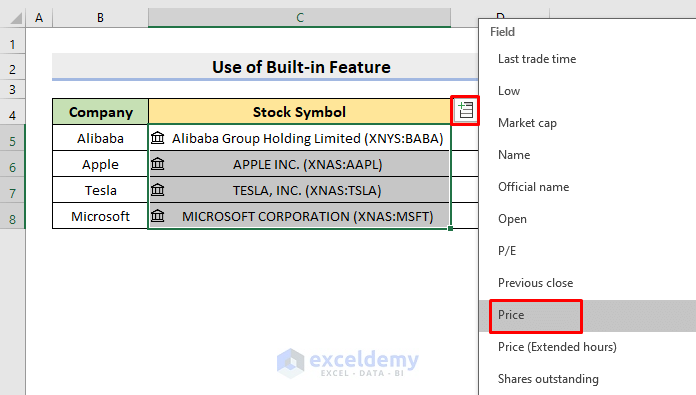
- It’ll return the price (in the next column) of the companies in a particle stock exchange market.
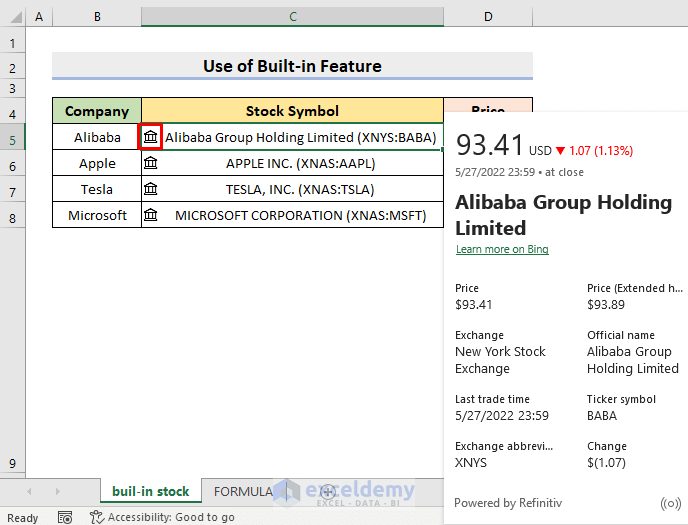
- Click the Show card icon (marked in a red square) to view detailed information about a specific company.
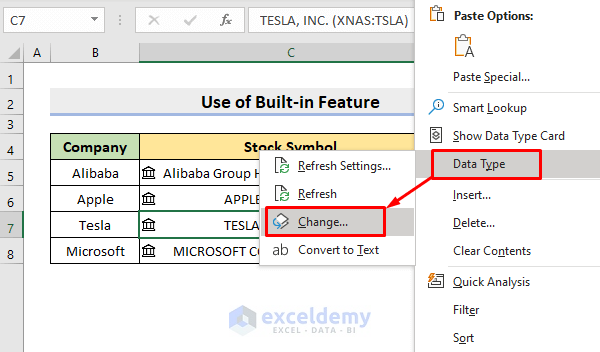
- Suppose you want to see stock prices from a different exchange market (e.g., London Stock Exchange).
- Right-click on the stock symbol in your worksheet.
- Select Data Type and click on Change.
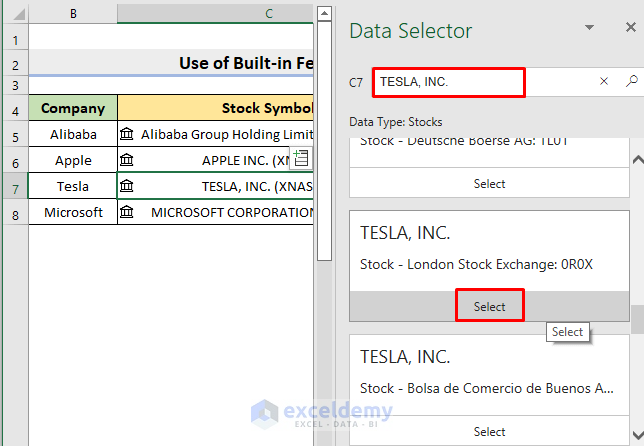
- The Data Selector pane will appear on the right side.
- In the first box, delete everything inside the brackets (leaving only the official company name).
- Click the search icon and find your desired exchange (e.g., London Stock Exchange).
- The updated stock price will be displayed.
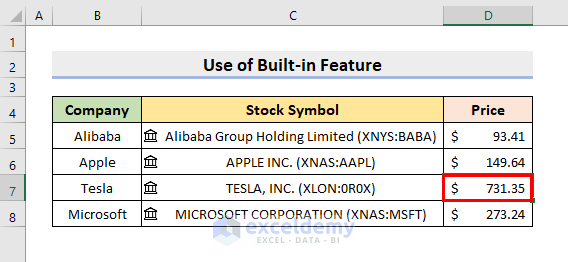
- To refresh the data and get the latest information, click Data and choose Refresh All.

Method 2 – Inserting a Formula
In addition to the built-in Stocks Data feature, you can use the STOCKHISTORY function to retrieve historical quote data for a specific company within a given date range. Follow these steps to perform the task:
STEPS
- Select cell D5 in your Excel worksheet.
- Enter the following formula:
=STOCKHISTORY(C5,"23-May-2022",,1,0,1)This formula retrieves stock data for the company represented by the stock symbol in cell C5, starting from May 23, 2022.
- Press Enter to apply the formula.
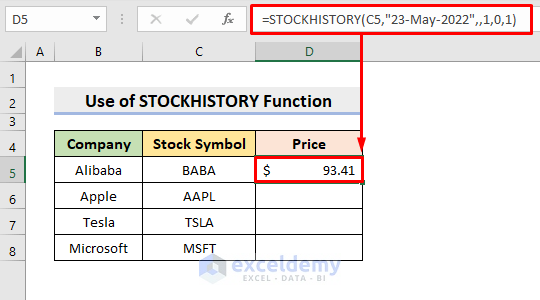
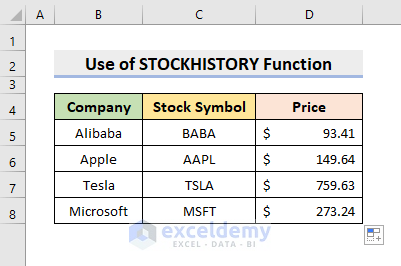
- Use the AutoFill tool to complete the rest of the list with historical stock data.
Read More: How to Download Historical Stock Data into Excel
Things to Remember
- The Stocks Data Type feature is currently available only in Excel 365. Other versions of Excel will gradually receive this feature.
- Ensure that you have the latest version of Microsoft Office or have updated it to the most recent version. Older versions may not support this feature.
- Set English as the Editing Language in Excel to enable the Stocks Data Type feature.
Download Practice Workbook
You can download the practice workbook from here:
Related Articles
- How to Calculate Beta in Excel
- How to Calculate CAPM Beta in Excel
- How to Calculate Alpha in Excel
- How to Calculate Alpha and Beta in Excel
<< Go Back to Stocks In Excel| Excel for Finance | Learn Excel
Get FREE Advanced Excel Exercises with Solutions!

