In general, you can save a chart as an image from the Context Menu by right-clicking. However this gets tedious when you have many charts in your workbook. Fortunately, you can use VBA to save all the charts at once.
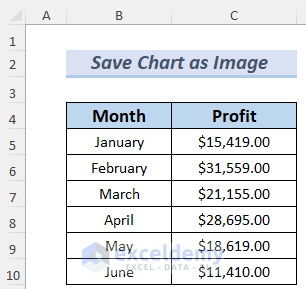
In the dataset below, we have a Profit statement of a shop for the first six months of a year. We will make charts from this information and save them as images using VBA.
Method 1 – Save a Single Chart as an Image
Steps:
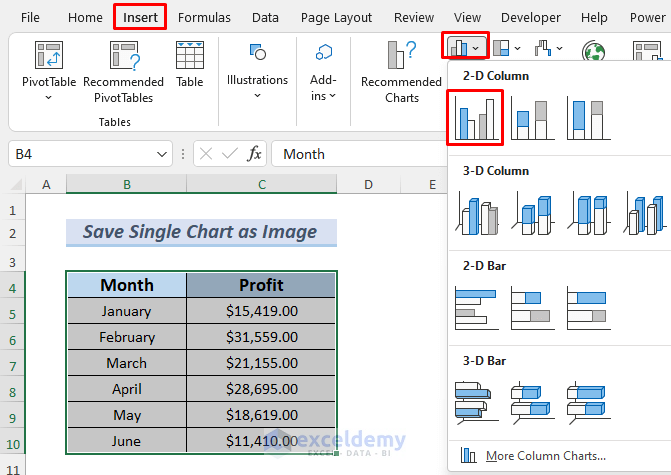
- Select the data and go to Insert >> Chart >> 2-D Column >> Clustered Column Chart.
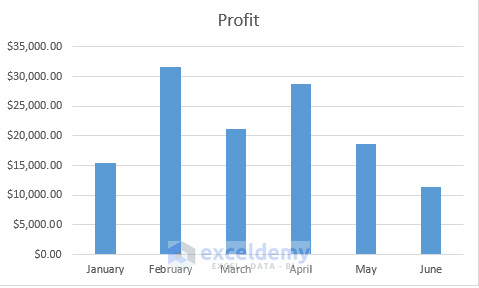
A corresponding Column Chart is generated in your sheet.
- Go to the Developer Tab and select Visual Basic.

The VBA editor will appear.
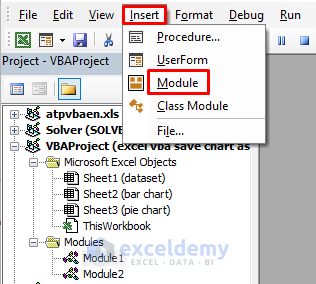
- Select Insert >> Module to open a VBA Module.
- Enter the following code in the VBA Module:
Option Explicit
Sub SaveChart()
Dim Chart_Obj As ChartObject
Dim Image_Chart As Chart
Dim nmyFileName As String

Set Chart_Obj = Sheets("column chart").ChartObjects(1)
Set Image_Chart = Chart_Obj.Chart
nmyFileName = "Image_Chart.png"

On Error Resume Next
Kill ThisWorkbook.Path & "\" & nmyFileName
On Error GoTo 0
Image_Chart.Export Filename:=ThisWorkbook.Path & "\" & nmyFileName, Filtername:="PNG"

MsgBox "Chart Saved As Image File"

End Sub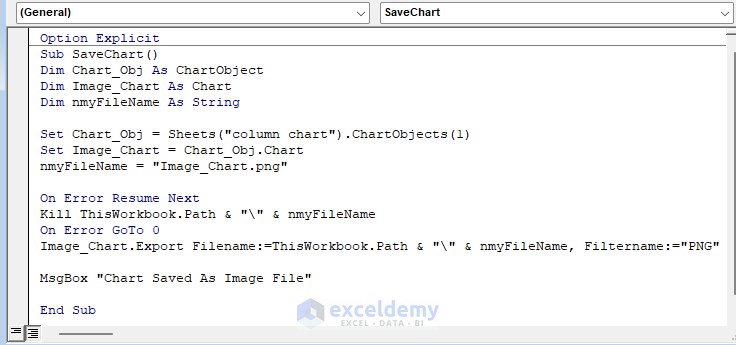
In this code, we declared Chart_Obj As ChartObject and Image_Chart as Chart. Then we used the ChartObjects property to set Chart_Obj to 1 (as we have only one chart in the column chart worksheet). We set a name for the image and its file location and defined the image type as .png. The image will be saved in the file location of the chart’s workbook.
- Go back to your sheet and Run the Macro named SaveChart.
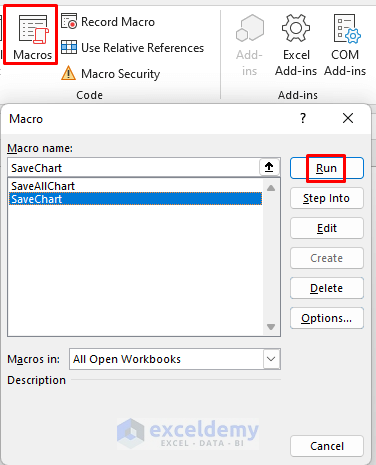
A message box showing Chart Saved As Image appears.
- Just click OK.

- Go to the file location of your current Excel workbook and you will find your chart image, which we saved as Image_Chart.
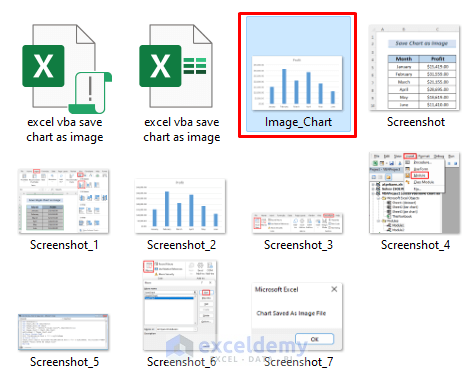
- Open it and observe that the file is saved as a PNG.

Read More: How to Save Image from Excel as JPG
Method 2 – Save All Charts in a Workbook
In the first method, we made a column chart using our dataset. Let’s make a Pie Chart this time.
Steps:
- Select your data and go to Insert >> Chart >> 2-D Pie Chart.
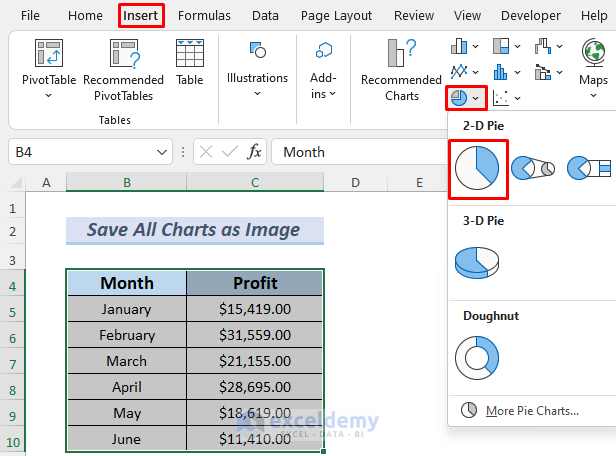
A corresponding Column Chart is generated in your sheet.

- Follow the steps of Method 1 to open a VBA Module.
- Enter the following code in the VBA Module:
Sub SaveAllChart()
Dim Work_Sheet As Excel.Worksheet
Dim Save_Destination As String
Dim Chart_Obj As ChartObject
Dim Chart_Image As Chart
Save_Destination = ActiveWorkbook.Path & "\"
For Each Work_Sheet In ActiveWorkbook.Worksheets
Work_Sheet.Activate
For Each Chart_Obj In Work_Sheet.ChartObjects
Chart_Obj.Activate
Set Chart_Image = Chart_Obj.Chart
myFileName = Save_Destination & Work_Sheet.Name & ".png"
On Error Resume Next
Kill Save_Destination & Work_Sheet.Name & Index & ".png"
On Error GoTo 0
Chart_Image.Export Filename:=myFileName, Filtername:="PNG"
Next
Next
MsgBox "Charts Saved As Image Files"
End Sub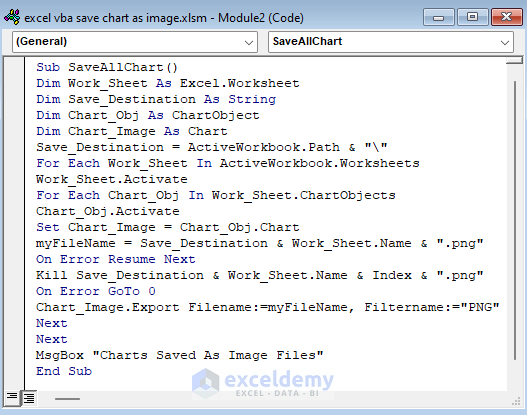
In this code, we declared Work_Sheet as Excel.Worksheet, Save_Destination as String, Chart_Obj as ChartOObject and Chart_Image as Chart. We set Save_Destination to the file location of this workbook with the ActiveWorkbook.Path property. Then we used a nested For Loop to identify the charts in each worksheet and name them after the names of the worksheets by using the ChartObjects and Name properties. We set the image file type to .png. The images will be saved in the file location of these charts’ workbook.
- Go back to your sheet and Run the Macro named SaveAllChart.

A message box showing Charts Saved As Images will appear.
- Just click OK.

- Go to the file location of your current Excel workbook and you will find your chart images. In the code, we named our charts after their corresponding worksheet names, column chart and pie chart.
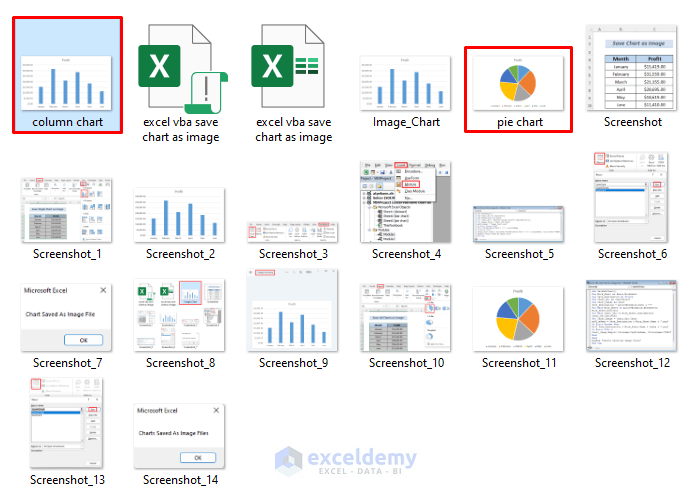
- Open them one by one.
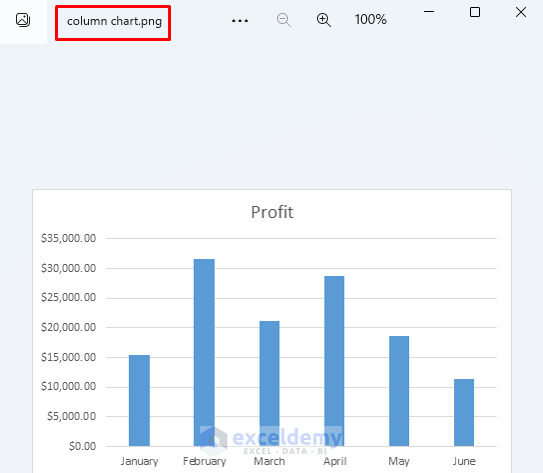
You will see the 2-D Clustered Chart if you open the column chart.
And you will see the 2-D Pie Chart after opening the pie chart

Download Practice Workbook
Related Articles
- Save Picture from Excel to Folder
- Save Excel Table as Image with High Resolution
- How to Save Excel Chart as High Resolution Image


