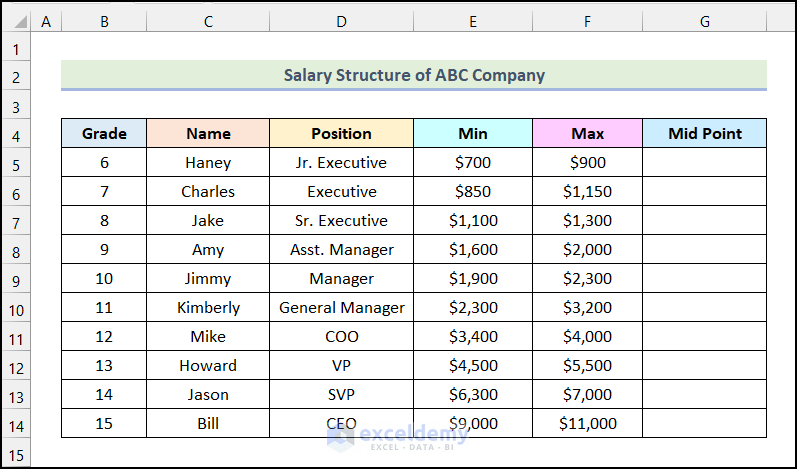
The dataset showcases the Salary Structure of the ABC Company with the minimum (Min) and maximum value (Max) of the salary range.
Method 1 – Using the AVERAGE Function
Steps:
- Use the following formula in G5.
=AVERAGE(E5:F5)E5:F5 indicates the first cells of the Min and Max columns.
- Press ENTER.
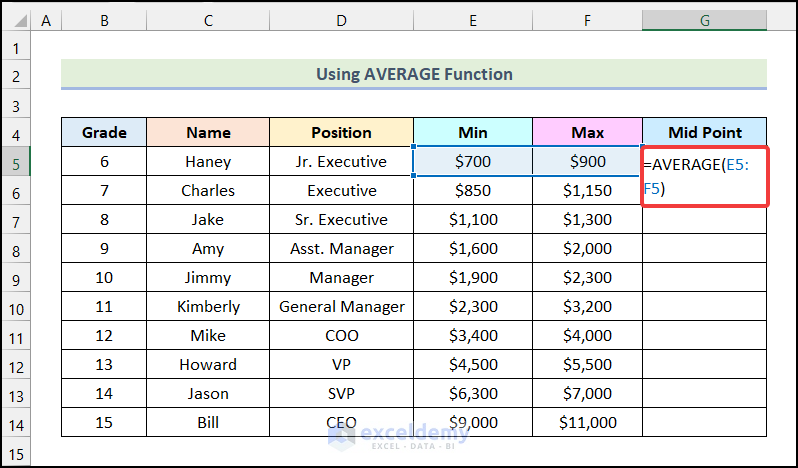
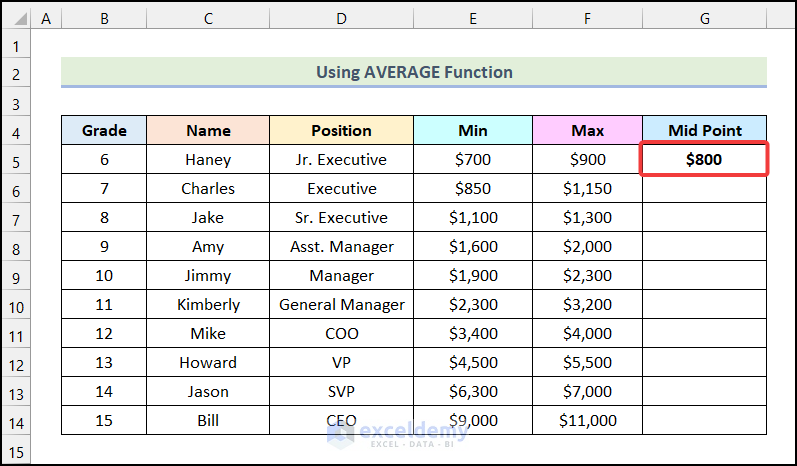
You will see the midpoint of the salary range for Haney in G5.
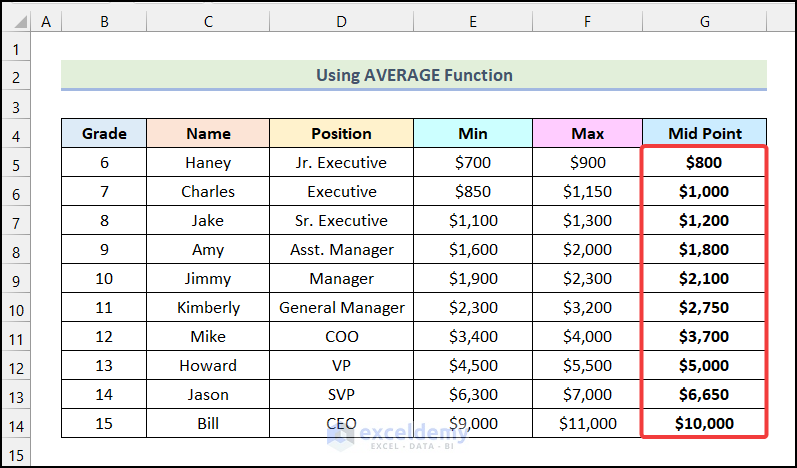
- Drag down the Fill Handle to see the result in the rest of the cells.
Method 2 – Applying a Mathematical Formula
Steps:
- Use the following formula in G5.
=(E5+F5)/2E5 represents the Min value of the salary range, and F5 indicates the Max value of the salary range.
- Press ENTER.
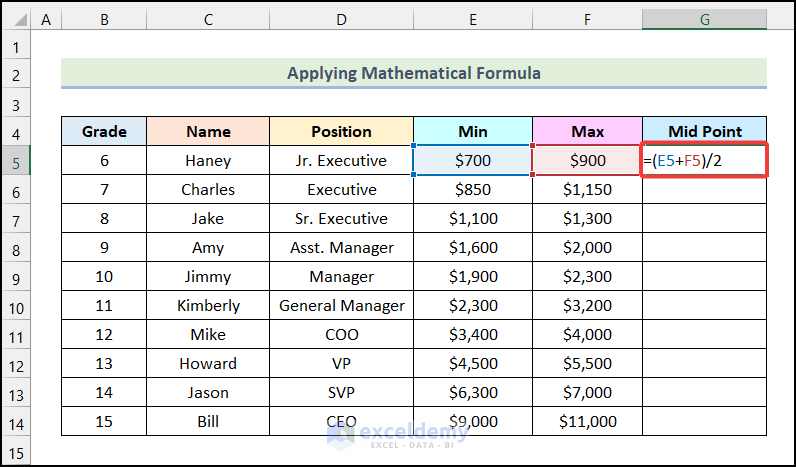
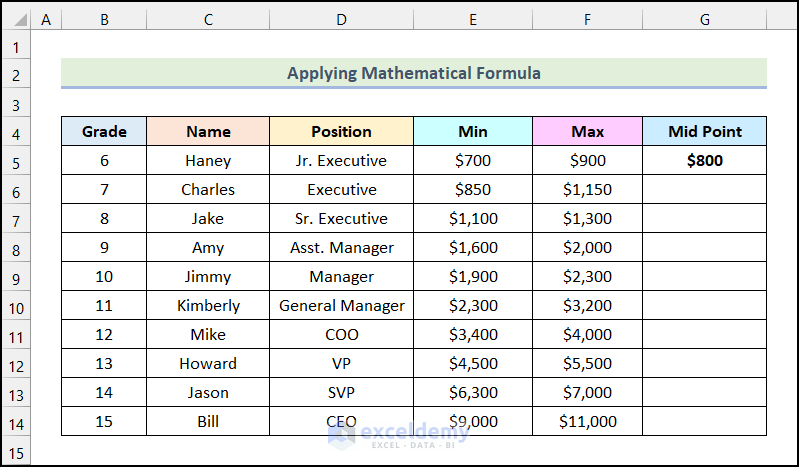
You will see the output in G5.
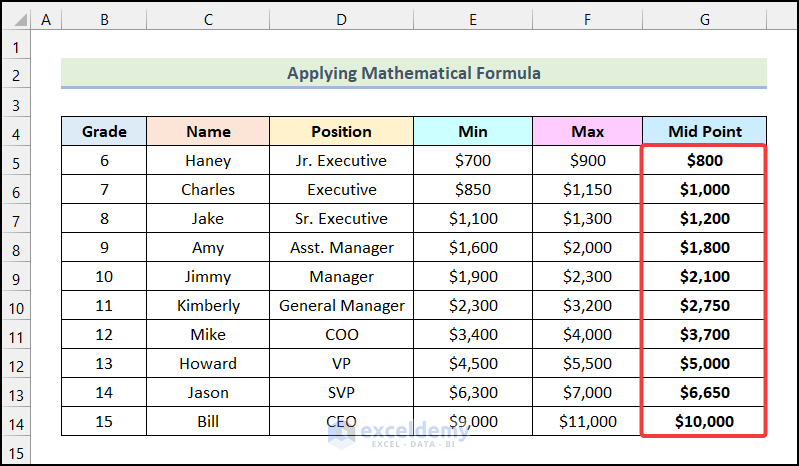
- Drag down the Fill Handle to see the result in the rest of the cells.
Method 3 – Utilizing the AutoSum Feature of Excel
Steps:
- Select the cells in the Mid Point column.
- Go to the Home tab.
- Click AutoSum in Editing.
- Choose Average.
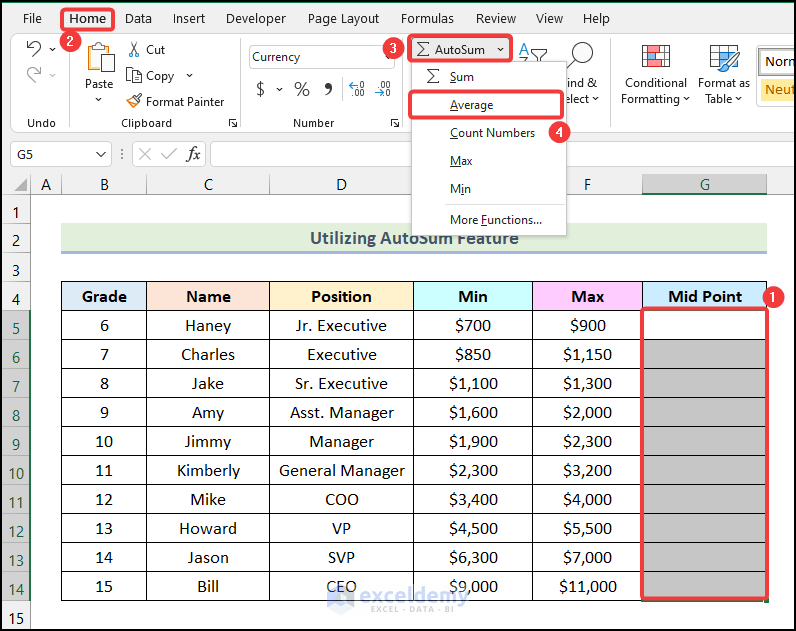
You’ll see the midpoint of the salary range.
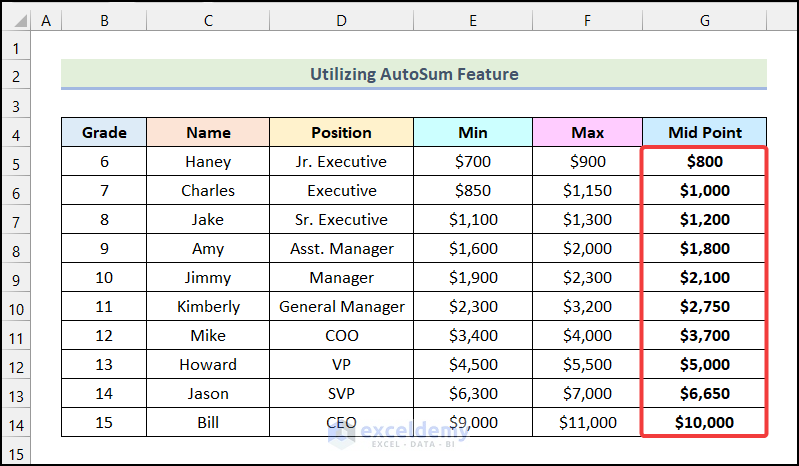
How to Calculate the Midpoint Progression of a Salary Range in Excel
Steps:
- Use the following formula in G6.
=(D6/D5)-1D6 indicates the Mid Point for the Executive Position, and D5 refers to the Mid Point for the Jr. Executive Position.
- Press ENTER.
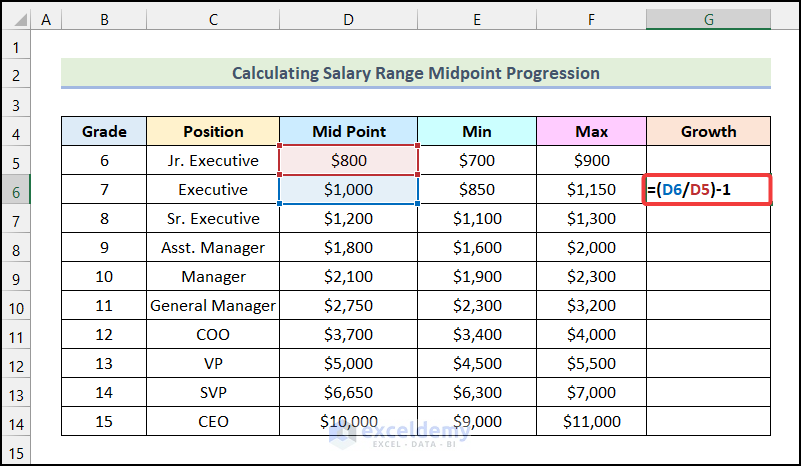
You will see the output in G6.
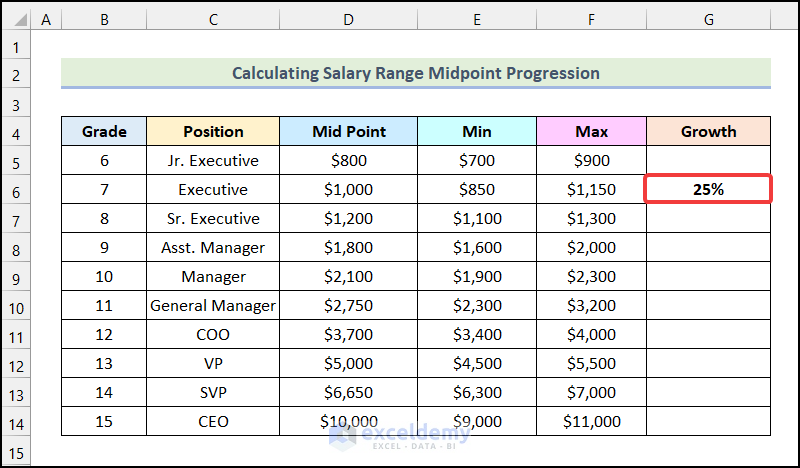
- Drag down the Fill Handle to see the result in the rest of the cells.
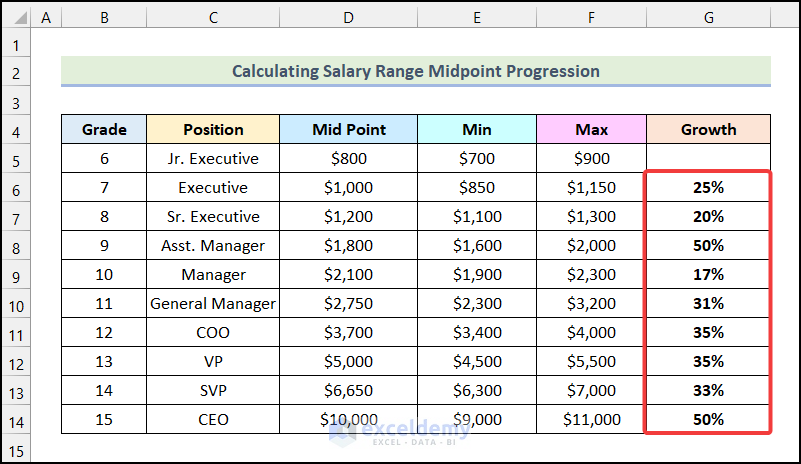
You can see that the Growth rates are not evenly distributed throughout different Positions.
To create an even Growth rate and Mid Point progression:
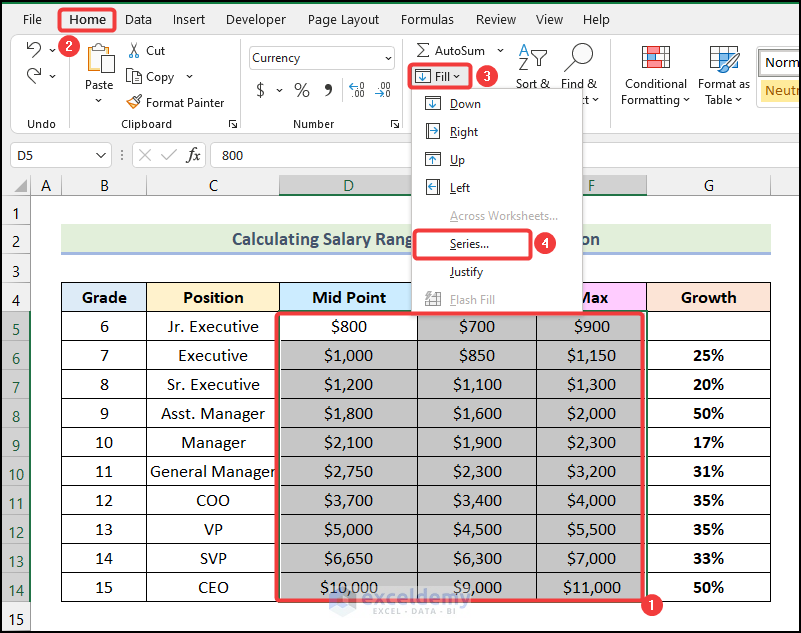
- Select the cells in the Mid Point, Min, and Max columns.
- Go to the Home tab.
- Choose Fill in Editing.
- Select Series.
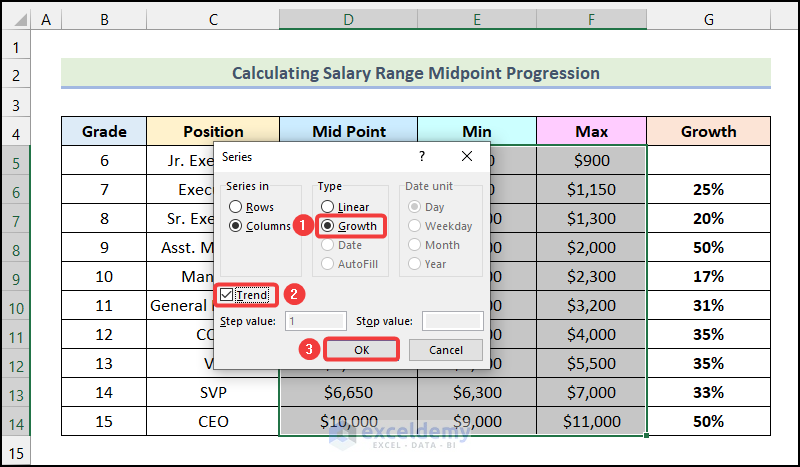
- Select Growth in the Series dialogue box.
- Check Trend.
- Click OK.
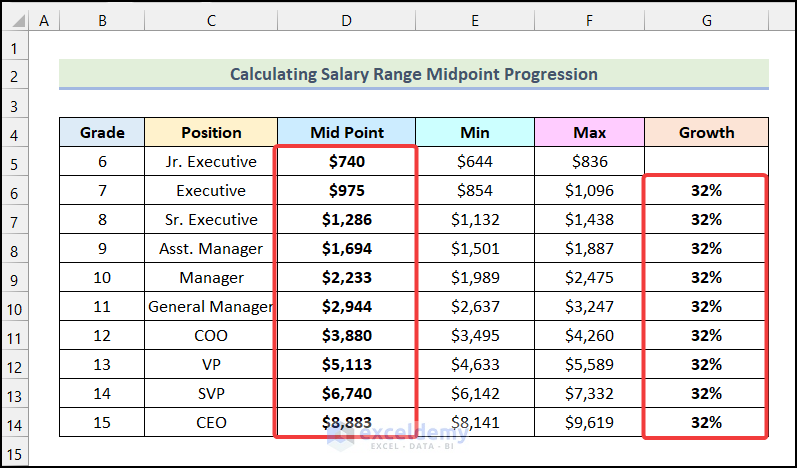
You will see the Growth rates and the Mid Point progression:
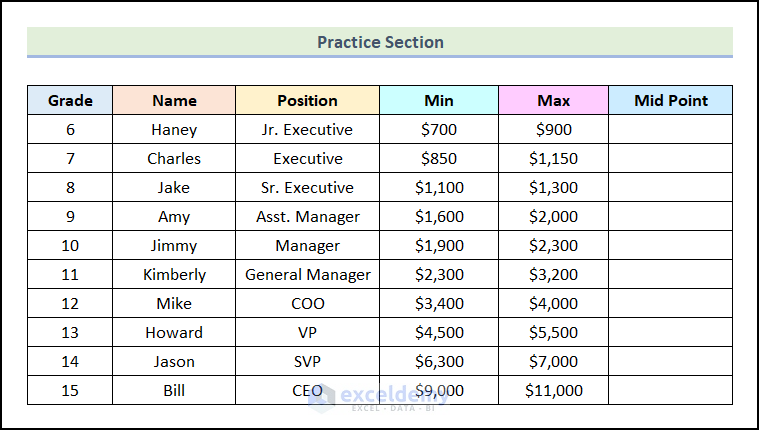
Practice Section
Practice here.
Download Practice Workbook
<< Go Back to Salary | Formula List | Learn Excel
Get FREE Advanced Excel Exercises with Solutions!

