Overview of Option Probability
Probability represents the likelihood of an event occurring among all possible outcomes. In the context of options, probability refers to the chance that an option will be “in the money” (ITM) or “out of the money” (OTM) before its expiration.
- An option is considered ITM when its strike price is lower than the current stock market price.
- Conversely, an option is OTM when its strike price is higher than the current stock market price.
- The intrinsic value of an option is associated with being ITM or OTM.
- ITM options have positive intrinsic value and are more likely to be exercised (but cost more).
- OTM options have negative intrinsic value and are less likely to be exercised (with a lower premium).
Option Probability Formula
The option probability can be calculated using the following formula:

Where:
- UP: Underlying Price
- SP: Strike Price
- V: Current Volatility
- t: Time to expiration (as a percentage of the year)
Call Probability
To find the call probability, use this formula:

Put Probability
The put probability can be calculated as:

Black-Scholes Approach
An alternative method involves the Black-Scholes theorem. First, calculate auxiliary parameters (d_1) and (d_2):
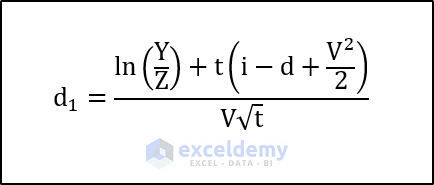
To calculate, we need to use the following formula.
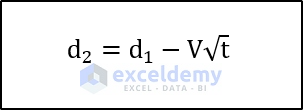
Compute the call price using:

And the put price:

Where:
- Y: Underlying Price
- Z: Strike Price
- V: Volatility
- i: Interest rate (as a percentage)
- t: Time to Expiration
- (N()) represents the normal distribution of the parameter inside the parentheses.
Creating the Excel Calculator
Step 1 – Prepare the Spreadsheet
- Set up a spreadsheet with input cells on the left and output cells on the right.
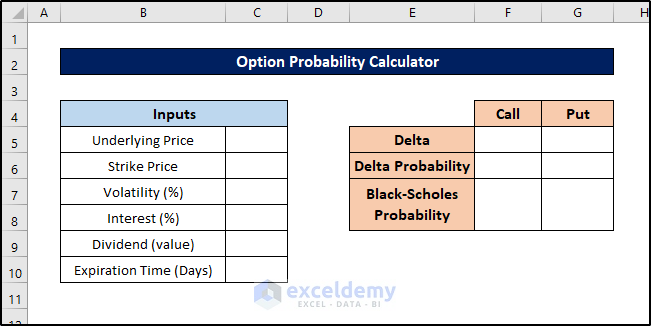
- We’ll use these cells to input particulars and display results.
Step 2- Insert Input Values
- Enter relevant values (such as underlying price, strike price, volatility, interest rate, and time to expiration) into the input cells.
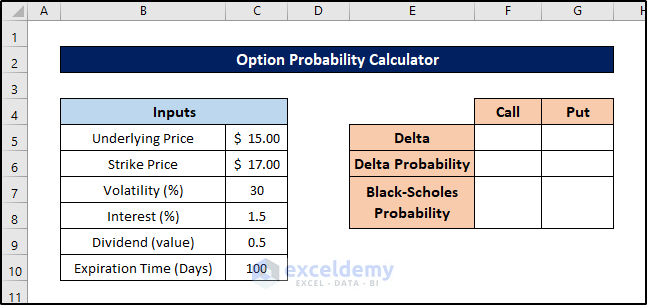
This step helps avoid errors in the output cells.
Step 3 – Calculate Delta Value for Call Option
- Select the cell where you want to store the delta value for the call option (e.g., cell F5).
- Enter the following formula:
=EXP(-C9*C9/100)*(NORM.DIST((((LN(C5/C6))+((C8-C9+(POWER(C7,2))/2)*(C10/365)/10000))/(C7*SQRT(C10/365)/100)),0,1,TRUE))
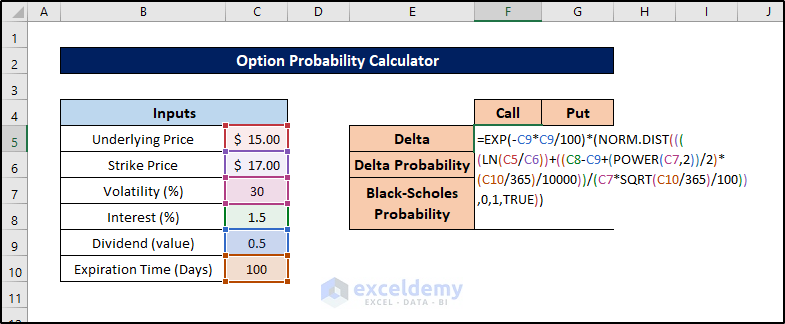
- Press Enter to calculate the delta value.
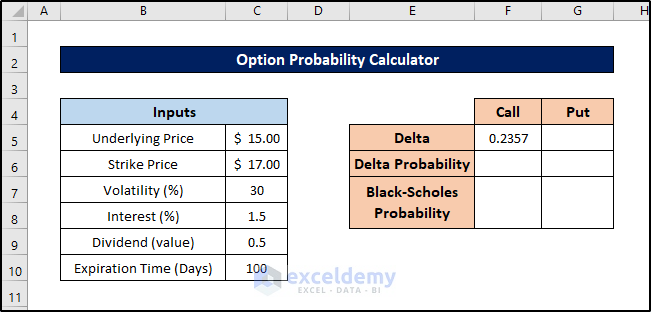
This way you can calculate the delta value for the call option of the probability calculator in Excel.
Step 4 – Compute Delta Value for Put Option
Similarly, we’ll calculate the delta value for the put option using the input values. Follow these steps:
- Select cell G5.
- Enter the following formula:
=EXP(-C9*(C10/365)/100)*((NORM.DIST((((LN(C5/C6))+((C8-C9+(POWER(C7,2))/2)*(C10/365)/10000))/(C7*SQRT(C10/365)/100)),0,1,TRUE))-1)
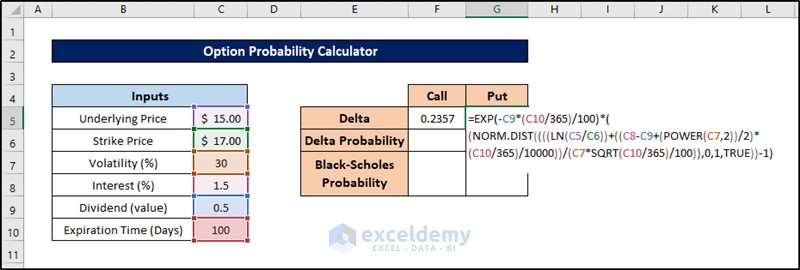
- Press Enter to calculate the delta value.
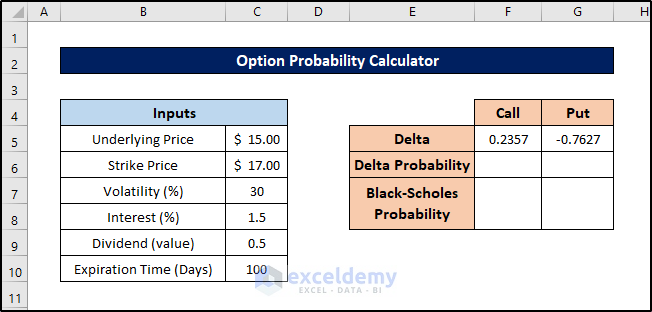
Step 5 – Calculate Probability from Delta Values
The delta values we’ve calculated represent probabilities relative to 1. To convert them to percentages, follow these steps:
- Select cell F6.
- Enter the formula:
=F5*100
- Press Enter. This is the probability from the delta for the call option.
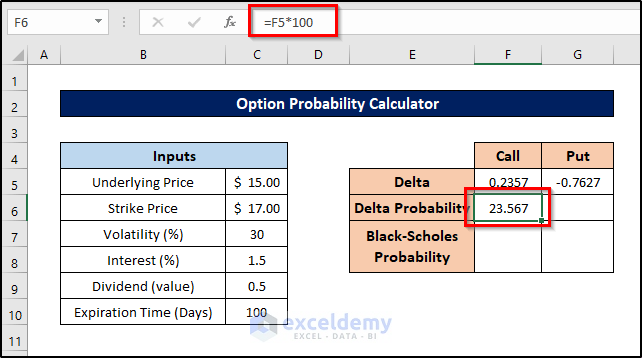
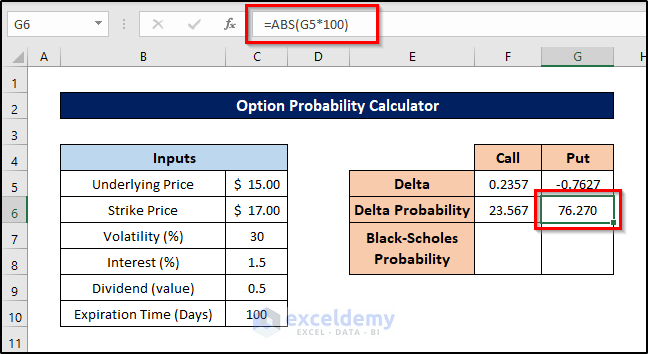
- For the put option, select cell G6 and enter the following formula:
=ABS(G5*100)
- Press Enter to calculate the put option probability.
Read More: How to Apply Weighted Probability in Excel
Step 6 – Determine Probability from Black-Scholes Approximation
Although not strictly necessary, let’s calculate the call and put options using the Black-Scholes theorem for comparison. Follow these steps:
- Select cell F7.
- Enter the formula:
=(NORMSDIST((LN(C5/C6))/(C7*SQRT((C10/365)/1000))))*100
- Press Enter.
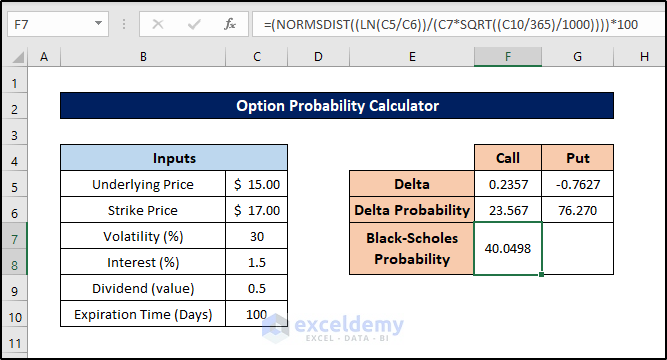
- Next, select cell G7 and enter this formula:
=(1-(NORMSDIST((LN(C5/C6))/(C7*SQRT((C10/365)/1000)))))*100
- Press Enter to find the probabilities from the Black-Scholes approach in the option probability calculator.
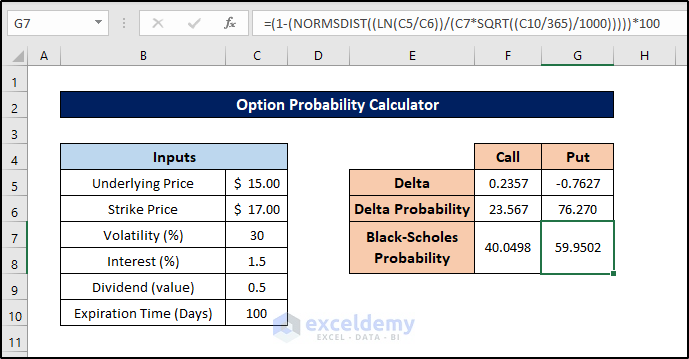
This way we can also find the probabilities from the Black-Scholes approach in the option probability calculator in Excel.
Let’s finally add some modifications to the spreadsheet to make it stand out.
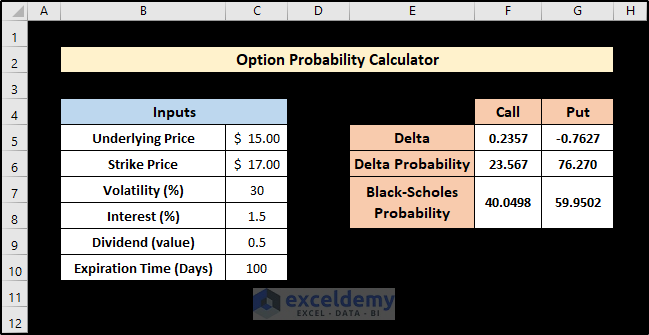
Read More: How to Calculate Empirical Probability with Excel Formula
Download Practice Workbook
You can download the practice workbook from here:
Related Articles
- Probability Formula for Lottery in Excel
- How to Calculate Probability Density Function in Excel
- How to Get Simulation Probability in Excel
<< Go Back to Excel Probability | Excel for Statistics | Learn Excel
Get FREE Advanced Excel Exercises with Solutions!


thank you sir , nice post.
need to ask about the “current volatility” means realised volatility or implied volatility ?
Hello AMIT,
I appreciate your question. I’d like to clarify that in this article, the expression “Current Volatility” refers specifically to Implied Volatility, rather than Realised Volatility. When working with Option Probability, it’s generally more advantageous to use Implied Volatility rather than Realised Volatility since it enables us to make more precise predictions about the projected price range of a stock in the future.
I hope this answers your question. If you have any more queries, please let us know.
Regards
Zahid
ExcelDemy
not a finance person but as i understand it so far , the realized volatility will generate a probability based on the past and implied Vol on what the market thinks and is betting on the probability to be for the contract end. the difference between the 2 is a regular trade strategy is referred to as “variance risk premium” .
and again i love the detailed post of yours.
regards amit