A Slope value describes the relationship between two values, typically the x and y values.
“Intercept” refers to the point where a line crosses the axis of a graph (x or y).
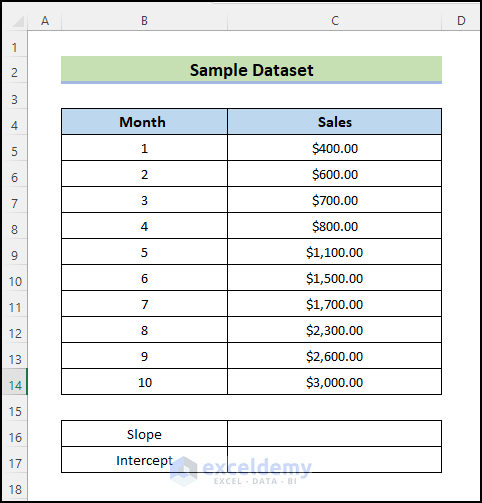
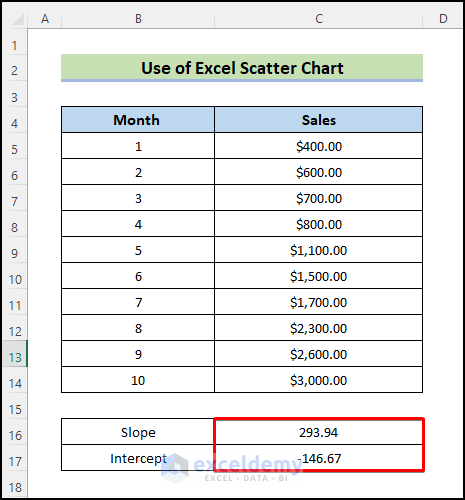
This is the sample dataset.
Method 1 – Using the SLOPE and INTERCEPT Functions
Steps:
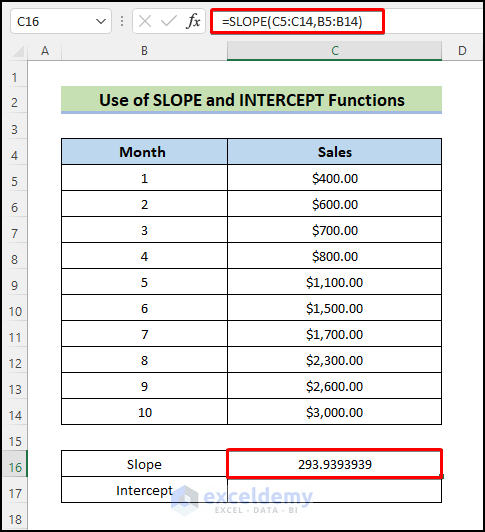
- To calculate the slope, select C16 and enter the following formula:
=SLOPE(C5:C14,B5:B14)
- Press Enter.
You will get the following slope value: 293.93.
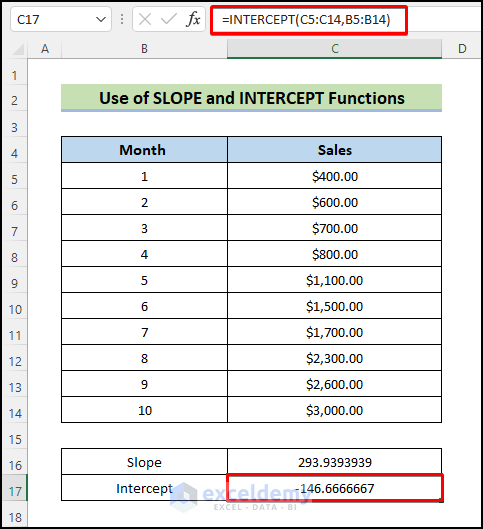
- To calculate the intercept, select C17 and enter the following formula:
=INTERCEPT(C5:C14,B5:B14)
- Press Enter.
You will get the following intercept value: -146.666.
Note:
- In the SLOPE function, arguments must be numerical. Empty cells or text strings will be disregarded.
- If a cell contains ‘0,’ it will be used in the calculation.
- The SLOPE function’ must contain equal ranges for the x and y values. Otherwise, you get a #N/A error.
- Utilize names, arrays, or references containing integers as parameters.
- If the known ys and xs have different or no data points, the INTERCEPT returns the #N/A error.
Read More: How to Find the Slope of a Line in Excel
Method 2 – Creating an Excel Scatter Chart to Calculate Slope and Intercept
Steps:
- Select B4:C14.
- Go to the Insert tab and select Charts.
- Click the Dropdown and choose Scatter.
- Select a chart.
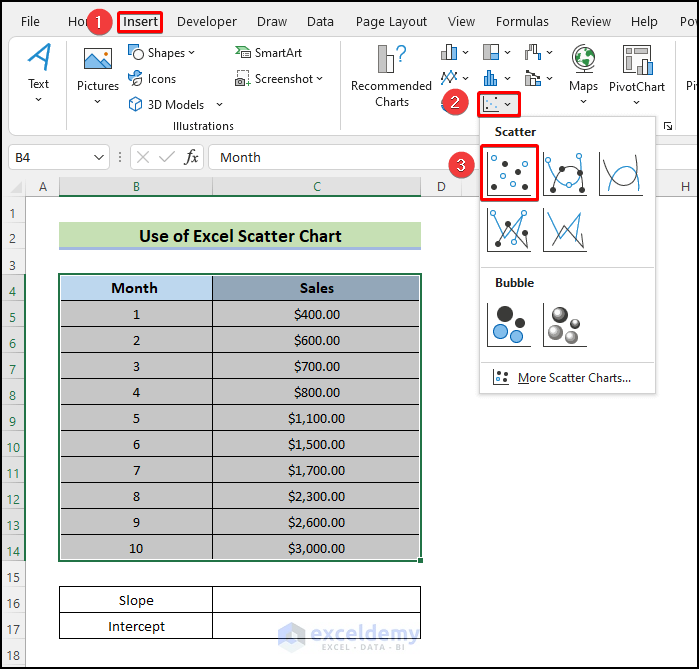
The chart is displayed.
- Right-click any point along the line.
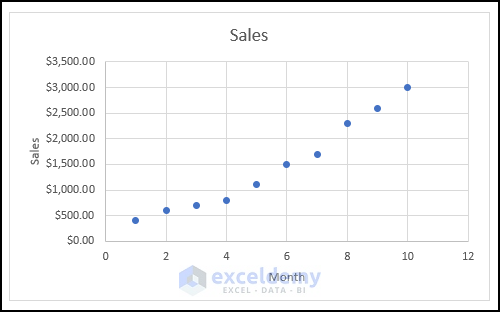
- Select Add Trendline.
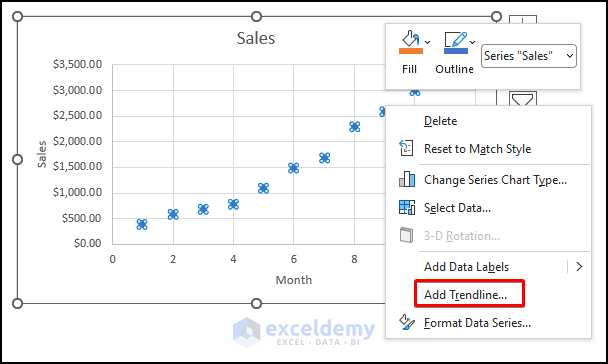
- Check Display Equation on chart.
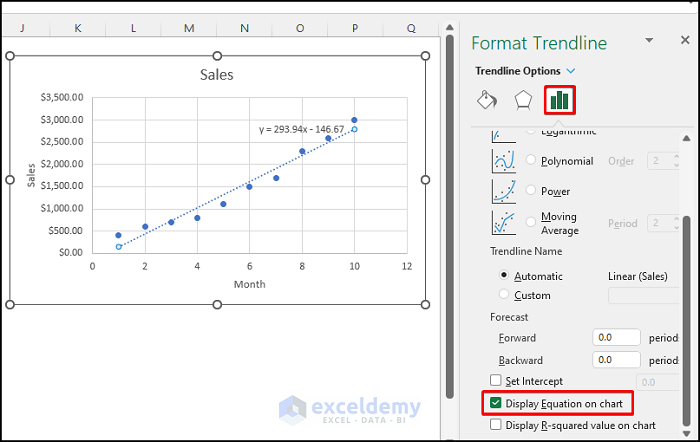
The equation y=293.94x -146.67 is displayed in the chart.
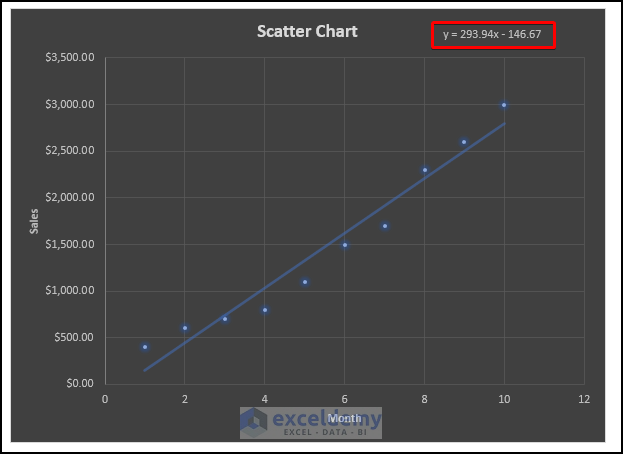
The slope is m= 293.94, and the intercept -146.67.
Read More: How to Find Instantaneous Slope on Excel
Method 3 – Create a Formula to Calculate the Slope
Steps:
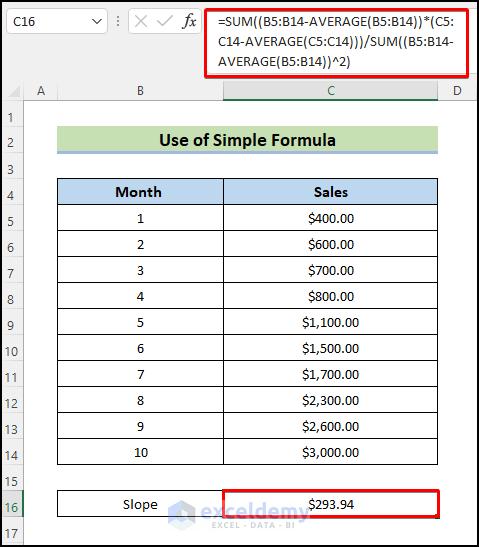
- To calculate the slope, select C16 and enter the following formula:
=SUM((B5:B14-AVERAGE(B5:B14))*(C5:C14-AVERAGE(C5:C14)))/SUM((B5:B14-AVERAGE(B5:B14))^2)
- Press Enter.
The slope is displayed in C16.
Formula Breakdown
- SUM((B5:B14-AVERAGE(B5:B14))) adds the average of the x-values in (B5:B14).
- *(C5:C14-AVERAGE(C5:C14)) returns the average of the y-values in (C5:C14), multiplied by the previous value.
- /SUM((B5:B14-AVERAGE(B5:B14))2) returns the average of the x-values subtracted from (B5:B14), which is the square number. The multiplied number is divided by the result.
Note:
- The value of the slope will be negative if you use increasing x-values and decreasing y-values. A negative slope forms an obtuse angle.
Read More: How to Find Slope of Logarithmic Graph in Excel
Download Practice Workbook
Related Articles
- How to Find the Slope of a Regression Line in Excel
- How to Calculate Slope of Exponential Graph in Excel
<< Go Back to Excel SLOPE Function | Excel Functions | Learn Excel
Get FREE Advanced Excel Exercises with Solutions!

