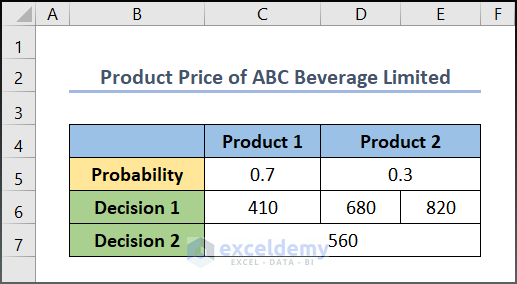
“Product Price of ABC Beverage Limited” is the sample dataset.
Example 1 – Creating a Decision Tree for 4 Events
Step 1: Construct Essential Shapes
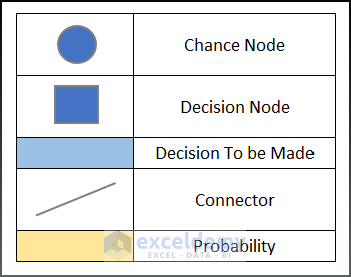
Specific shapes are necessary to draw a decision tree:
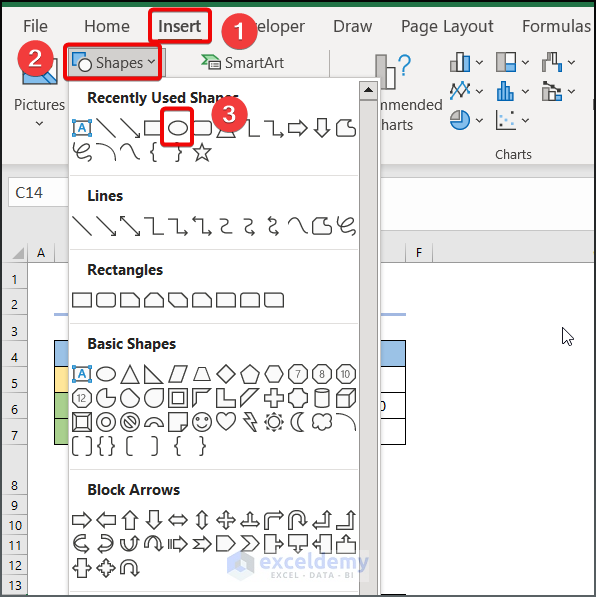
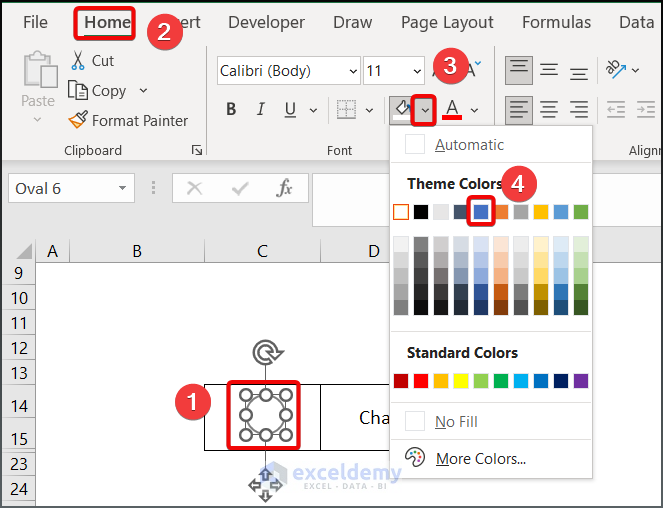
- Go to Insert > Shapes >Oval.
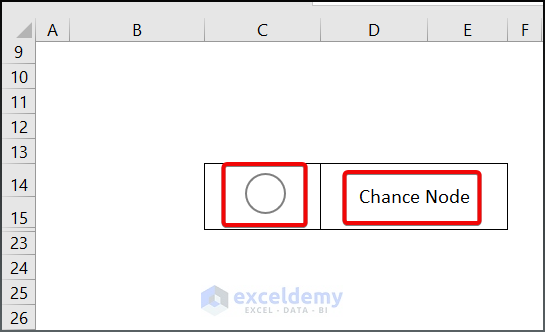
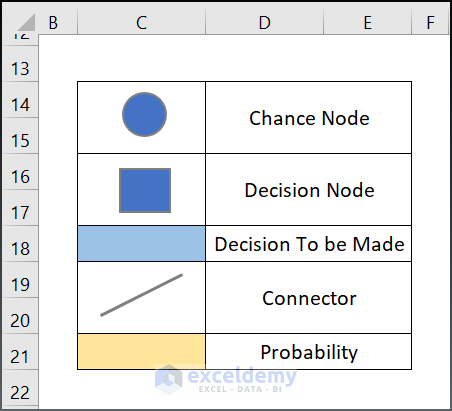
- The oval shape is labelled as Chance Node in the decision tree.
- Choose Blue on the Font ribbon to fill the shape .
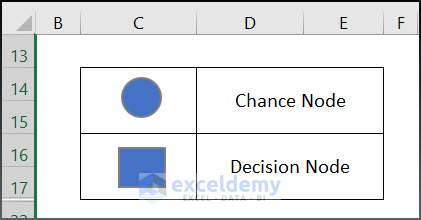
- Draw a Rectangular box below the Oval shape and fill it with Blue. Label it Decision Node.
This is the output.
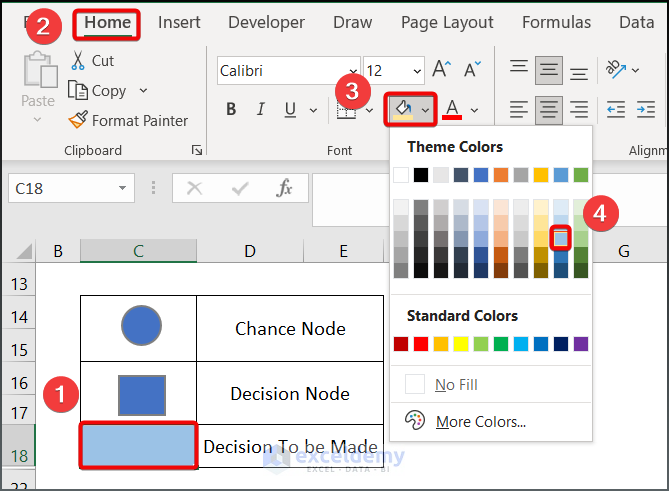
- Fill another cell with Blue accent 5 lighter 40% and label it “Decision to Be Made”.
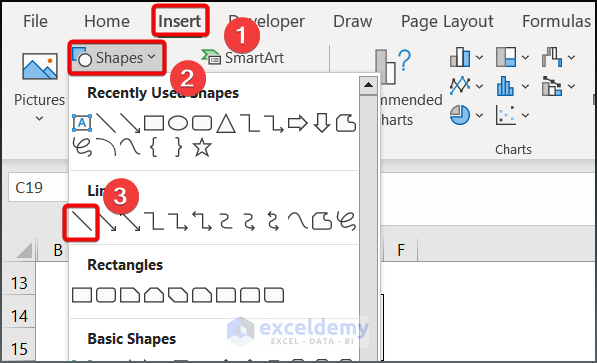
- Go to Insert > Shapes > Line command and draw a line.

This is the output.

- Fill a box with Gold Accent 4, 60% Lighter and label it probability box.
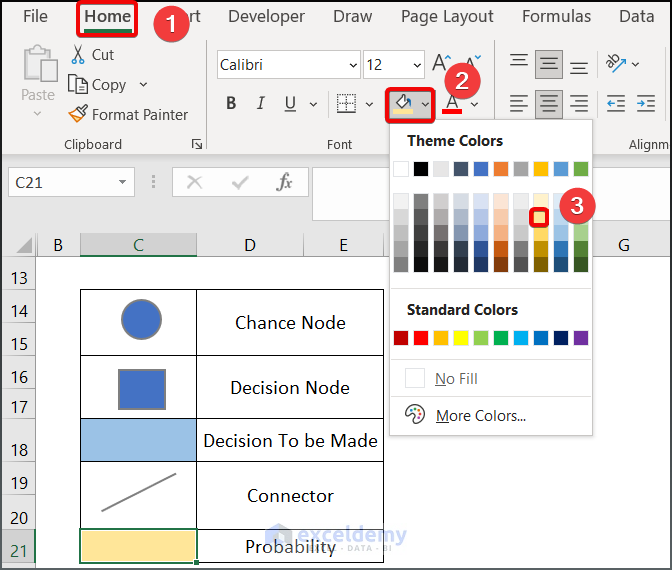
This is the output.
Step 2: Make a Basic Outline of the Tree
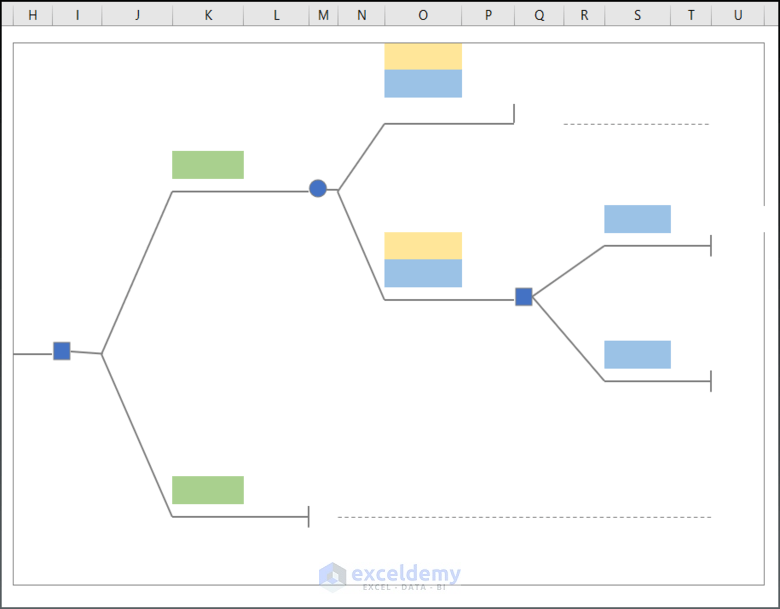
- Use CTRL+C & CTRL+V to recreate the figure.
Step 3: Label & Input Values in the Decision Tree
- Input the corresponding value of the dataset in the recreated tree.
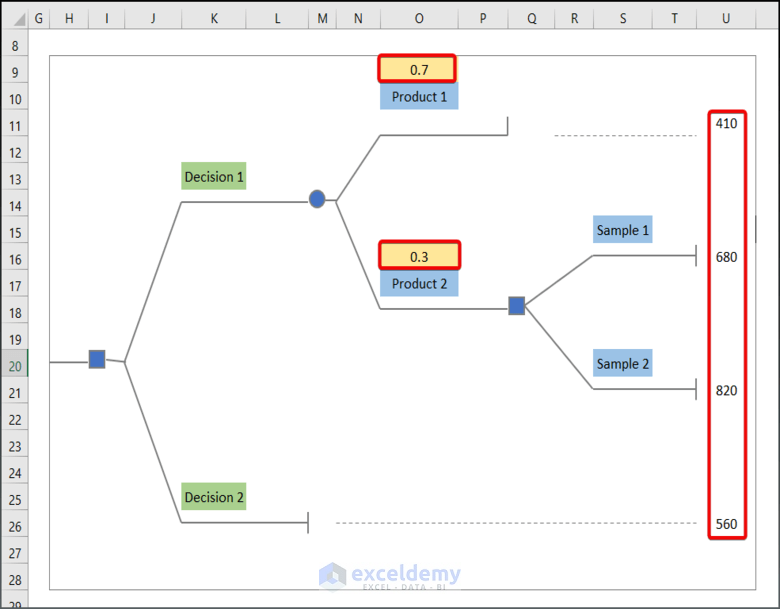
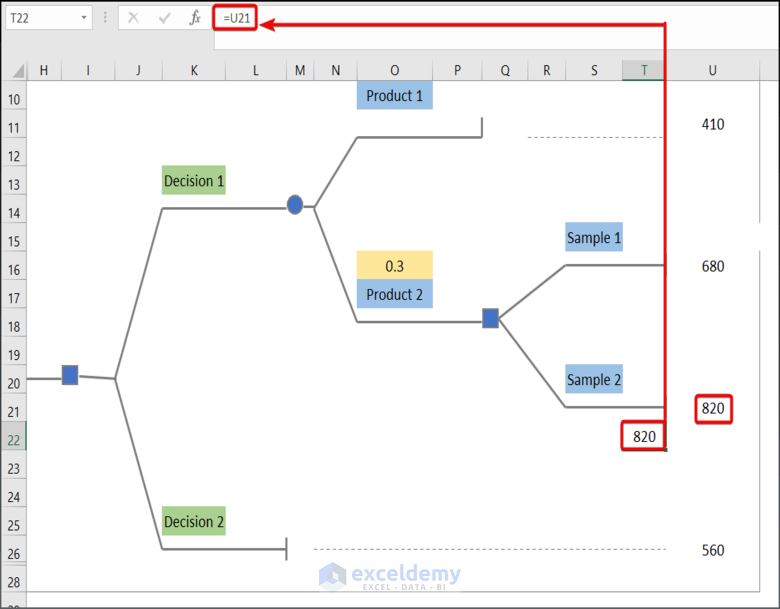
- Enter the following formula in T22 to return event value 820.
=U21
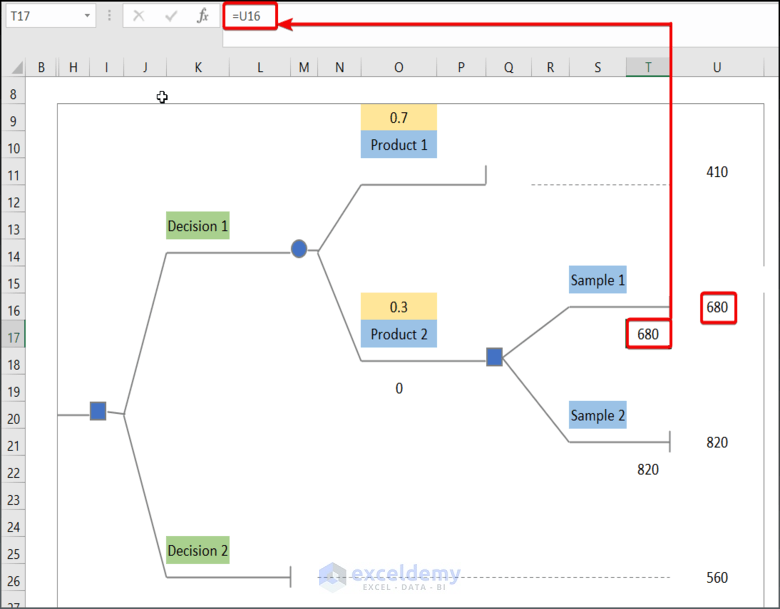
- Enter the following formula to bring the value of U16 into T17.
=U16
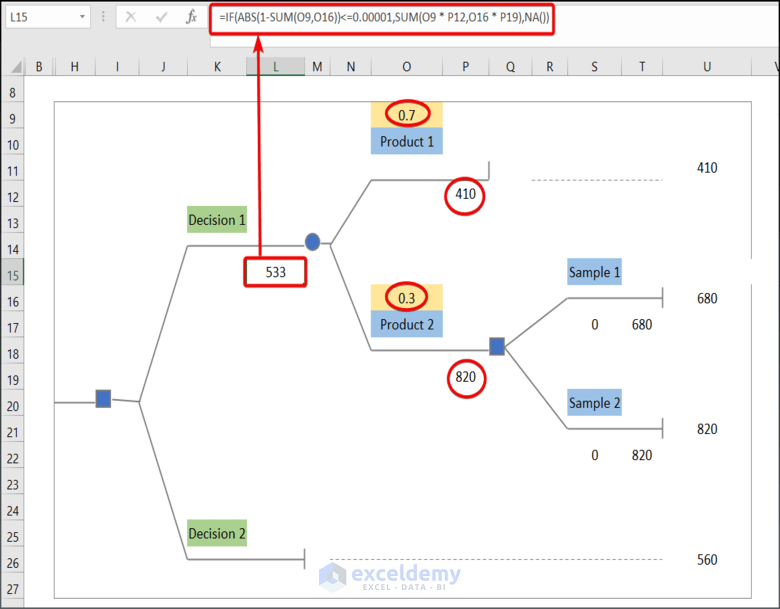
- Insert the following formula in L15.
=IF(ABS(1-SUM(O9,O16))<=0.00001,SUM(O9 * P12,O16 * P19),NA())Formula Breakdown:
- SUM(O9 * P12,O16 * P19) → The SUM function returns the product of O9*P12 and O16*P19.
- Output → 533
- ABS(1-SUM(O9,O16))→ The ABS function returns the absolute value of 1-SUM(O9,O16)
- Output → 0
- IF(ABS(1-SUM(O9,O16))<=0.00001,SUM(O9 * P12,O16 * P19),NA()) → checks whether a condition is met and returns one value if TRUE and another value if FALSE. Here in the IF function, ABS(1-SUM(O9,O16))<=0.00001 is the logical_test argument that checks if the value of the sum of O5 and O16 cells is close to If. So, the function will execute the (value_if_true argument) SUM(O9 * P12,O16 * P19) or return NA (value_if_false argument).
- Output → 533
This is the output.
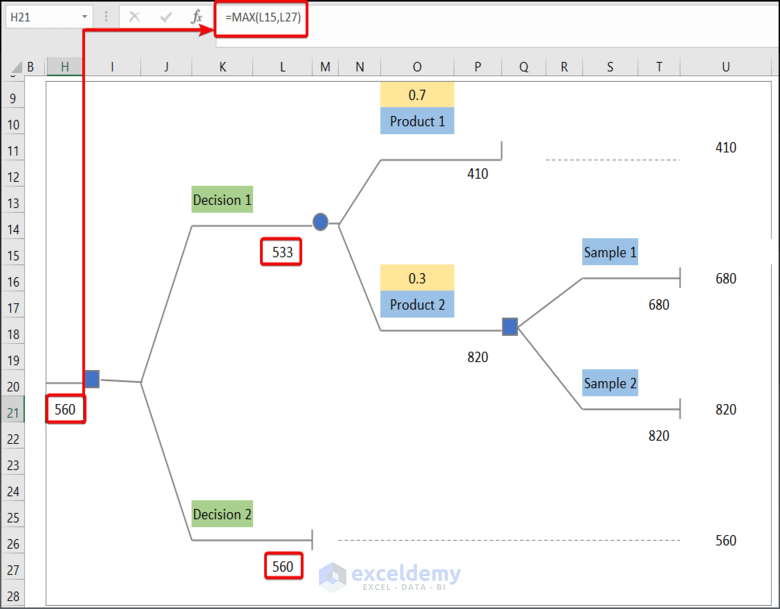
- Enter 560 in L27 (the value of U26).
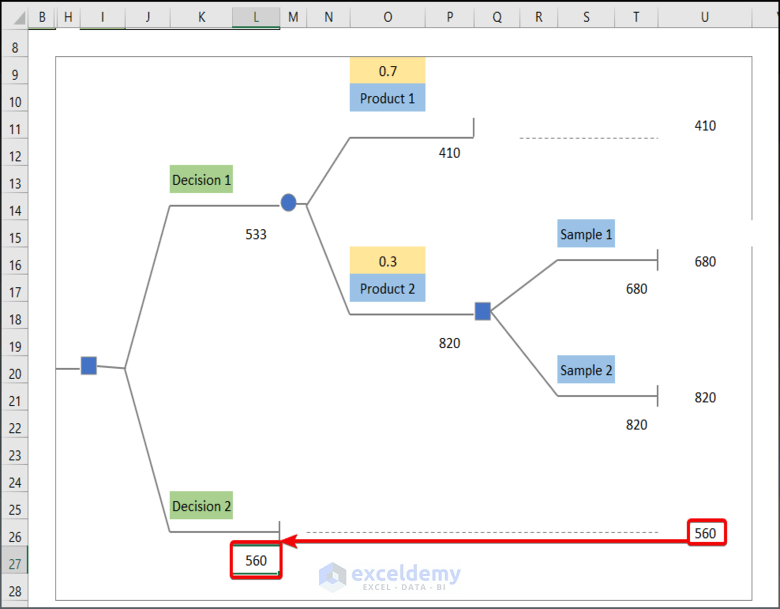
- Enter the following formula in H21.
=MAX(L15,L27)the MAX function returns the maximum value between L15 and L27.
The best decision in this dataset is 560.
Read More: How to Use Artificial Intelligence in Excel
Example 2 – Making a Decision Tree for 6 Events
Step 1: Create a Basic Outline of the Decision Tree
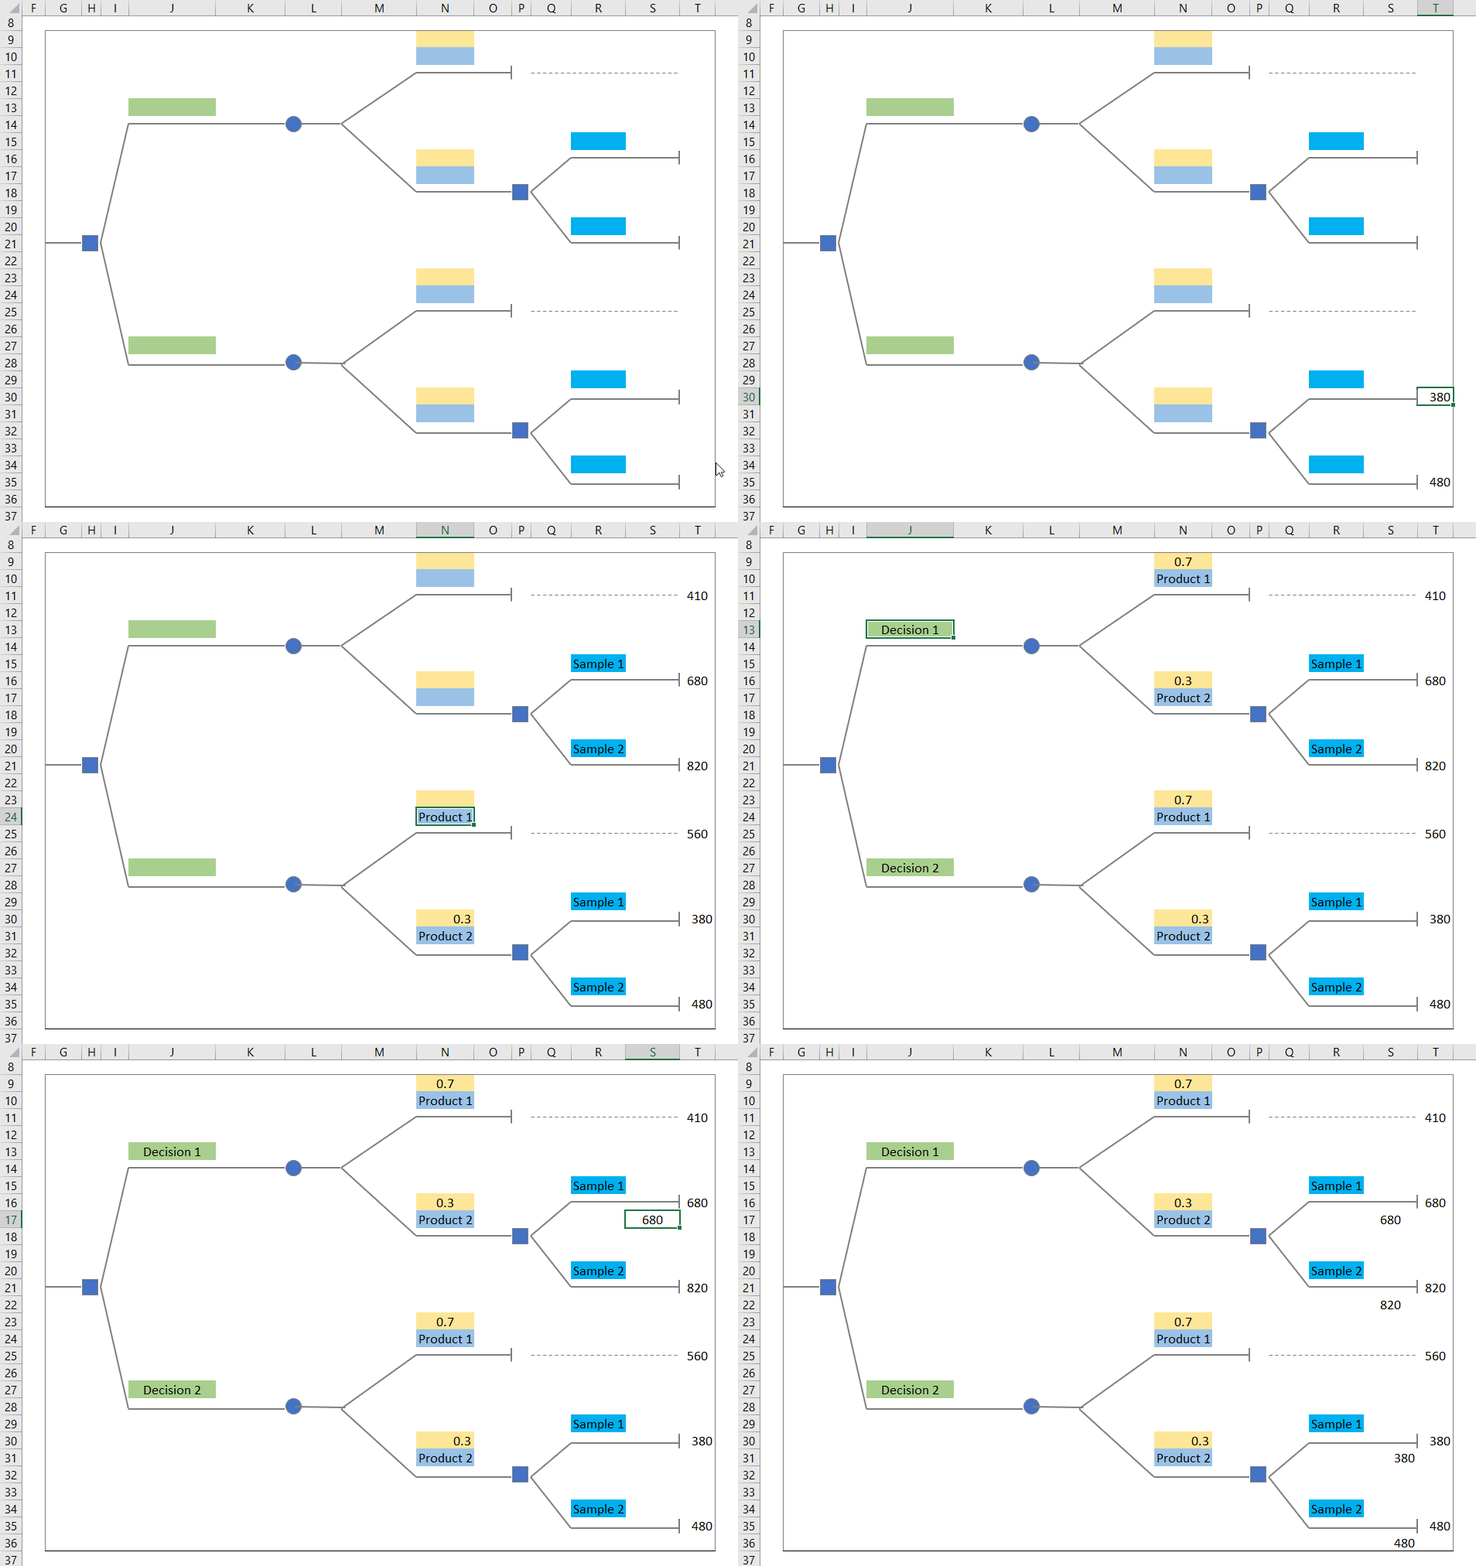
- Press CTRL+C & CTRL+V and recreate the figure.

Step 2: Label Decision Tree and Input Values
- Input the corresponding data and label the chart.
- Enter the following formula in O33.
=MAX(S31,S36)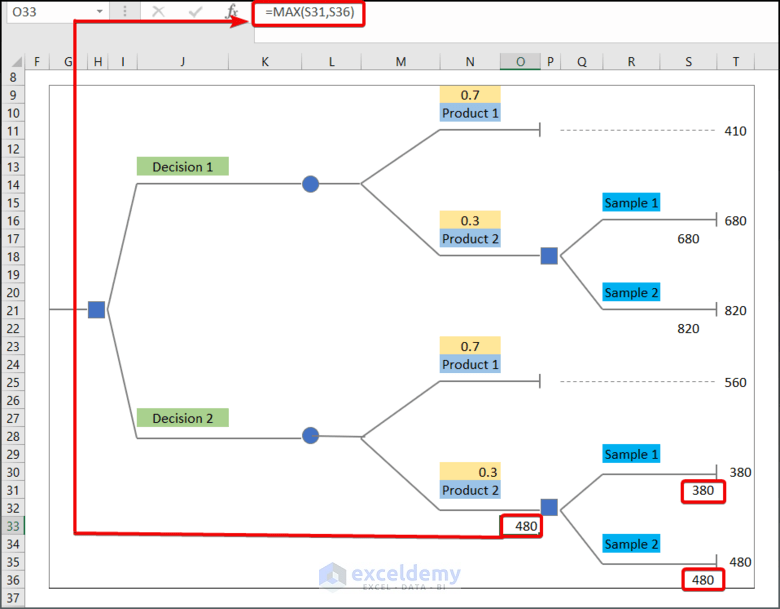
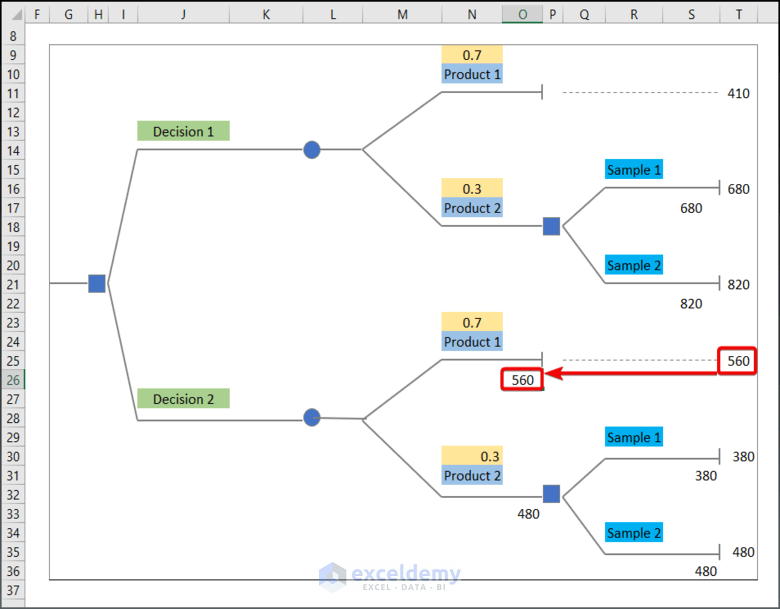
- Enter 560 into O26 to move the value in T25 into O26.
- Enter the following formula in O19.
=MAX(S17,S22)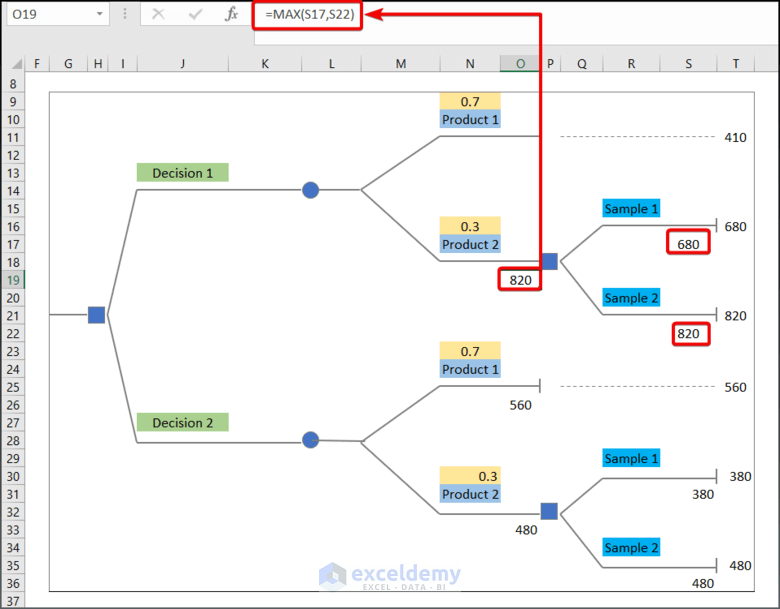
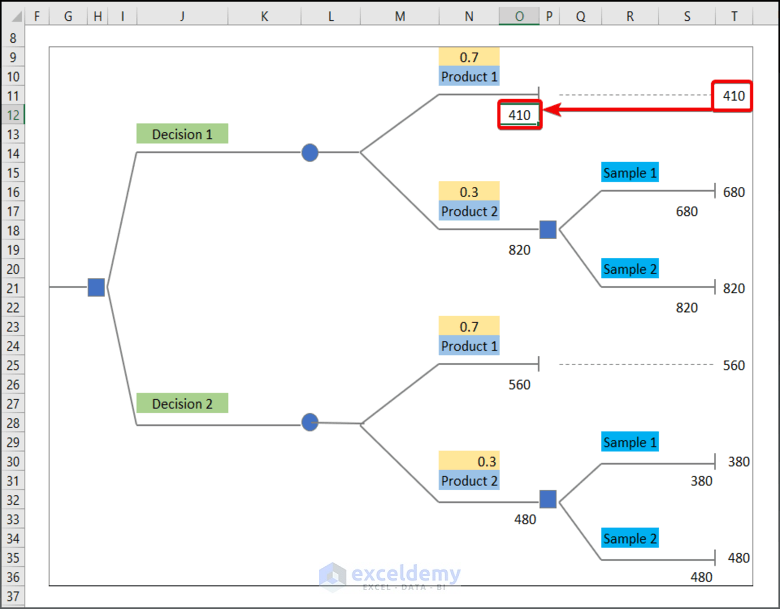
- Enter the data in T10 and 410 in O12.
- Enter the following formula in K15.
=IF(ABS(1-SUM(N9,N16))<=0.00001,SUM(N9 * O12,N16 * O19),NA())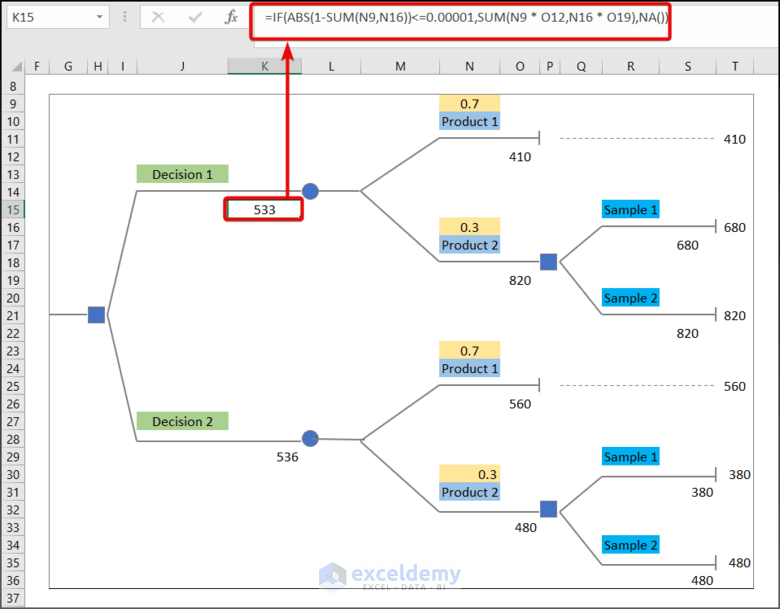
- Enter the following formula in K29.
=IF(ABS(1-SUM(N23,N30))<=0.00001,SUM(N23 * O26,N30 * O33),NA())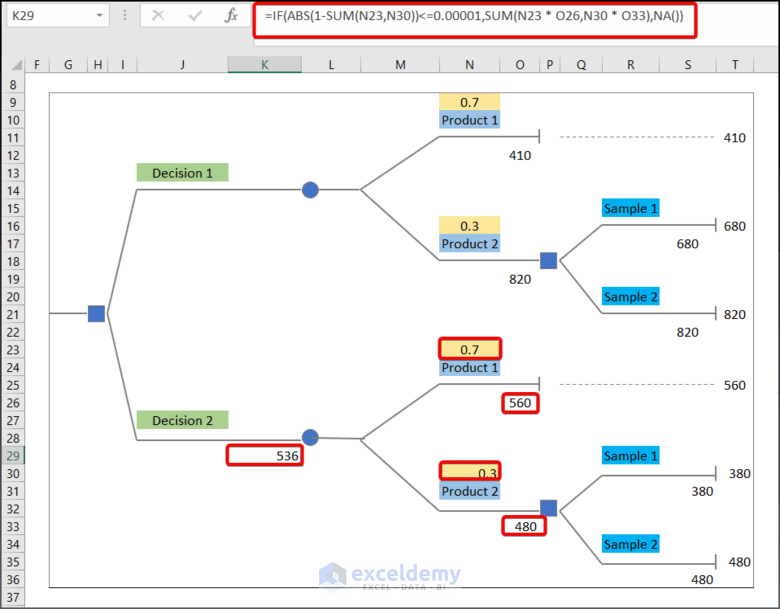
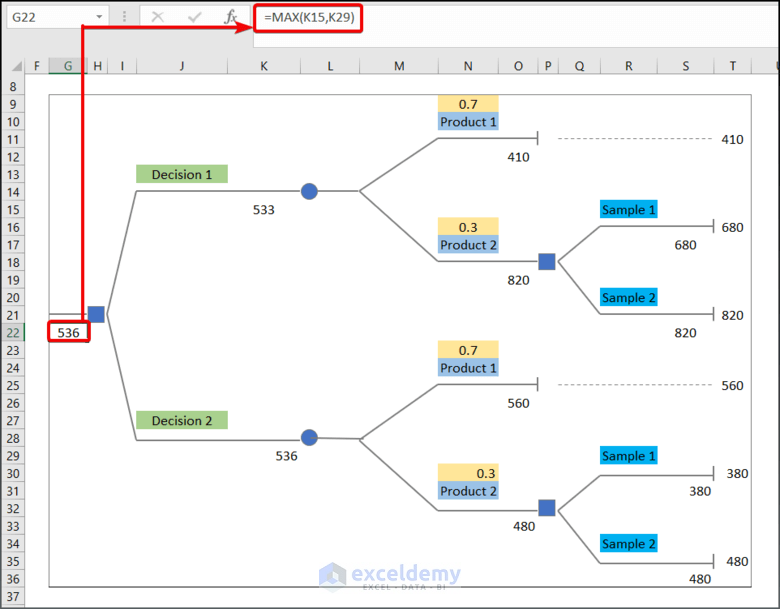
- Enter the following formula in G22 to find the maximum value of the two given decisions.
=MAX(K15,K29)This is the complete decision tree.
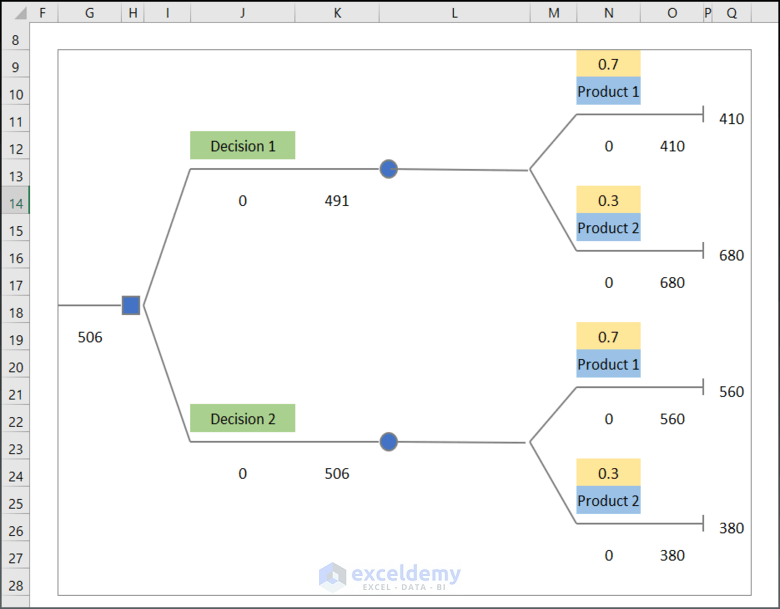
Example 3: Generating a Decision Tree with Equal Branches
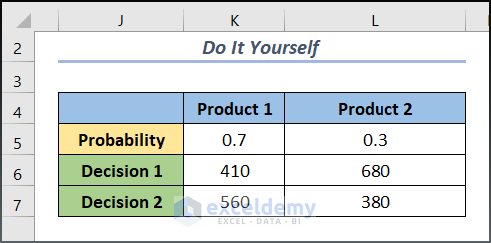
- This is the dataset.

- Create two decision nodes and two chance nodes. This is the output.
Read More: How to Build Lottery Prediction Algorithm in Excel
Practice Section
Practice the decision tree algorithm in Excel.
Download Practice Workbook
Download and practice.
Related Articles
- How to Create Betting Algorithm in Excel
- How to Perform Machine Learning in Excel
- How to Use Fuzzy LOOKUP Algorithm in Excel
- How to Create Rainflow Counting Algorithm in Excel
<< Go Back to Algorithm in Excel | Learn Excel
Get FREE Advanced Excel Exercises with Solutions!- SUM(O9 * P12,O16 * P19) → The SUM function returns the product of O9*P12 and O16*P19.


