Understanding COUNTIFS
When working with data in Excel, you might need to count occurrences within specific date boundaries. The COUNTIFS function allows you to do just that. Whether you’re analyzing sales data, tracking employee attendance, or managing inventory, understanding the frequency of events within a date range is crucial.
The COUNTIFS function counts the number of cells that meet multiple conditions. When dealing with dates, Excel treats them as serial numbers (with ‘Jan 1, 1900’ as 1). You can use logical operators such as >, <, >=, and <= to set conditions within the COUNTIFS formula.
Note:
- Excel COUNTIFS and SUMPRODUCT functions were introduced from the Excel 2010 version.
⏷ Case 1: Count Dates in a Date Range
⏷ Case 2: Count Occurrence of a Specific Year in a Date Range
⏷ Case 3: Count Occurrence of a Specific Date in a Date Range
⏷ Case 4: Count Dates in a Date Range That Match Another Criteria
Case 1 – Counting Dates in a Date Range
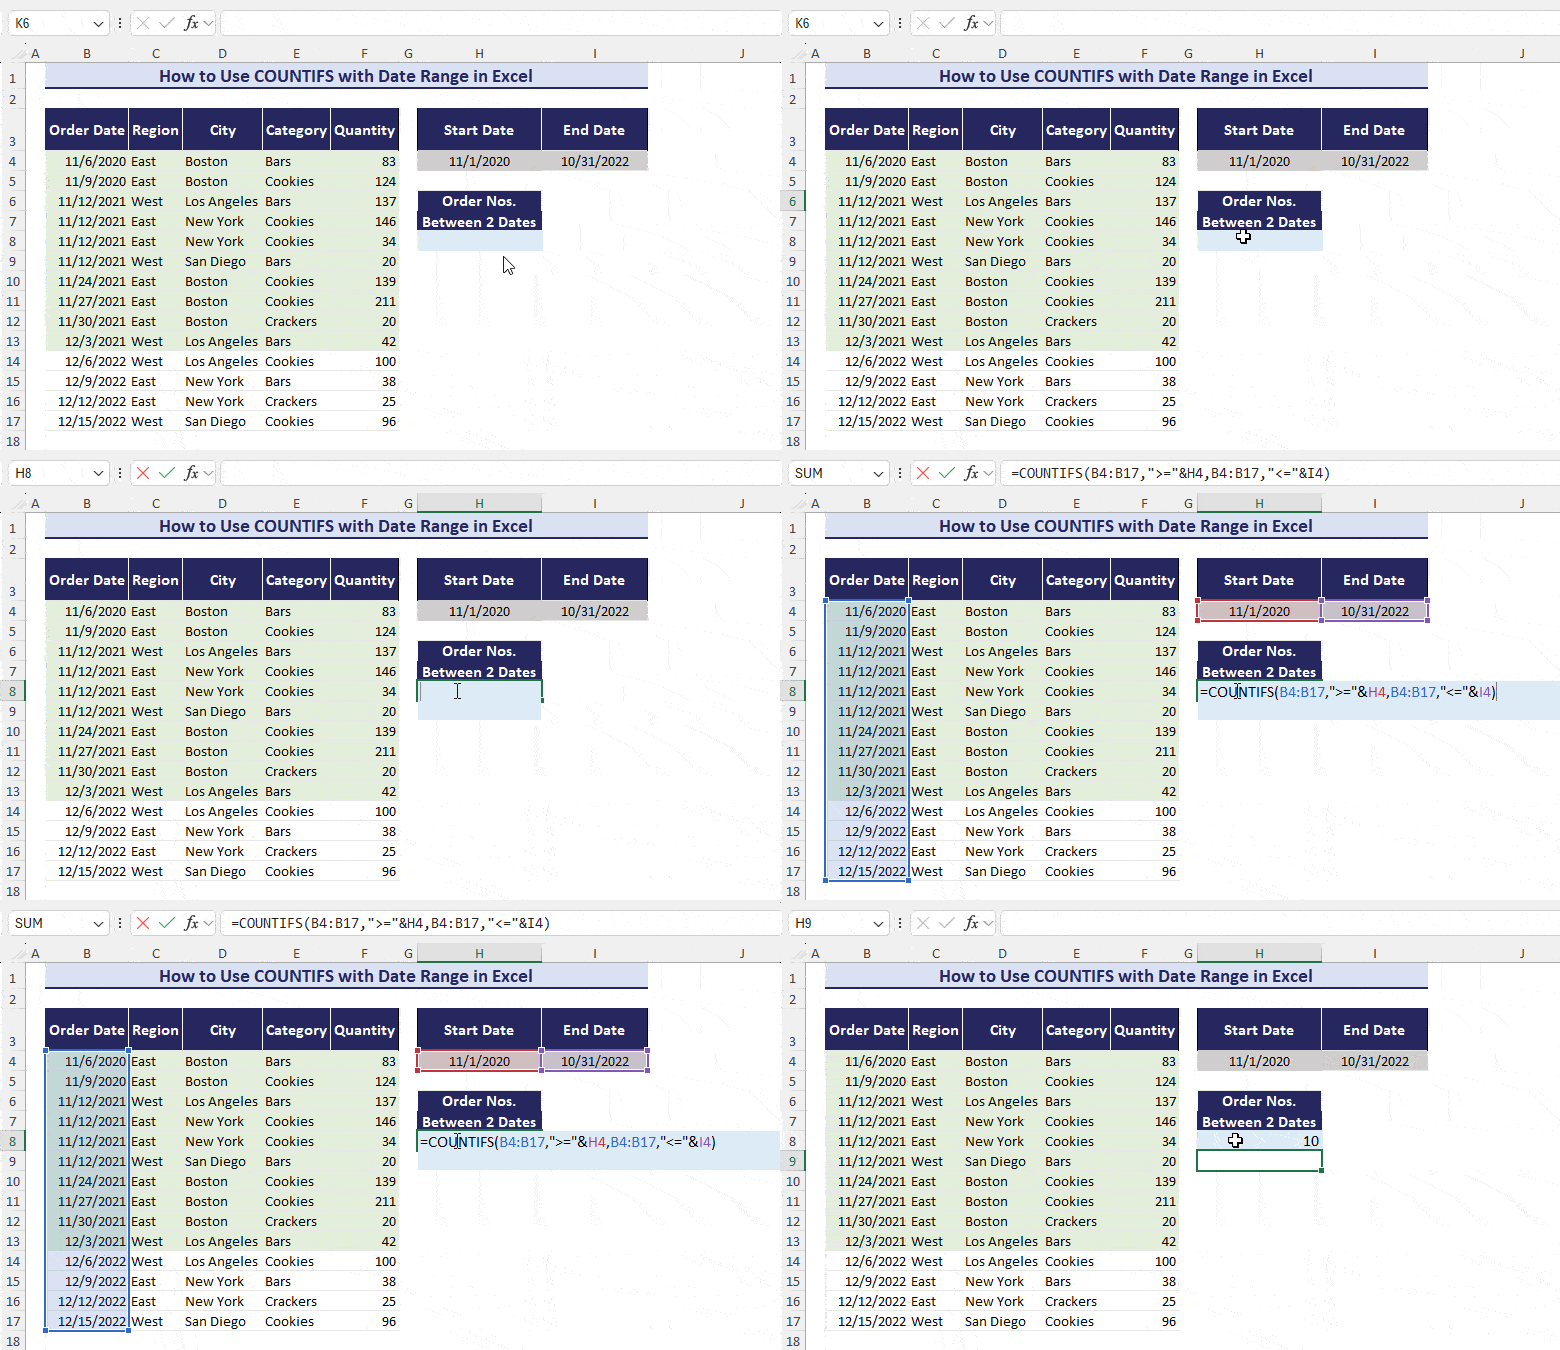
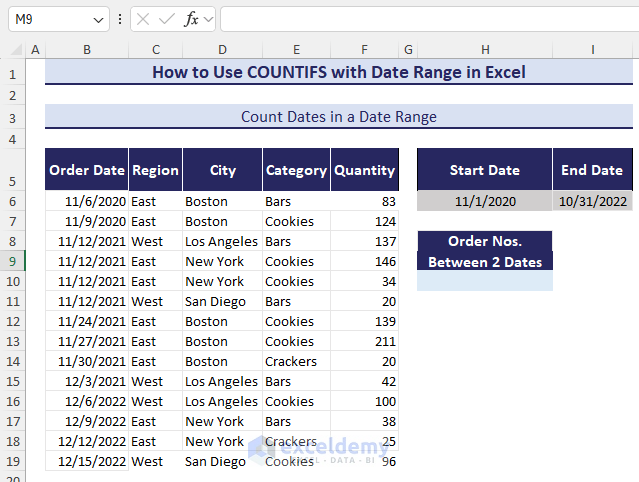
Suppose you have a dataset with columns like Order Date, Region, City, Category, and Quantity. Let’s count the number of orders made between November 1, 2021, and October 31, 2022.
- Set Up Your Data:
- Organize your data with an Order Date column.
- Define the date range (Nov 1, 2021, to Oct 31, 2022).
- Calculate the Count:
- In cell H6, enter the start date (11/1/2020).
- In cell I6, enter the end date (10/31/2022).
-
- In cell H10, enter the following formula:
=COUNTIFS(B6:F19,">="&H6,$B$6:$F$19,"<="&I6)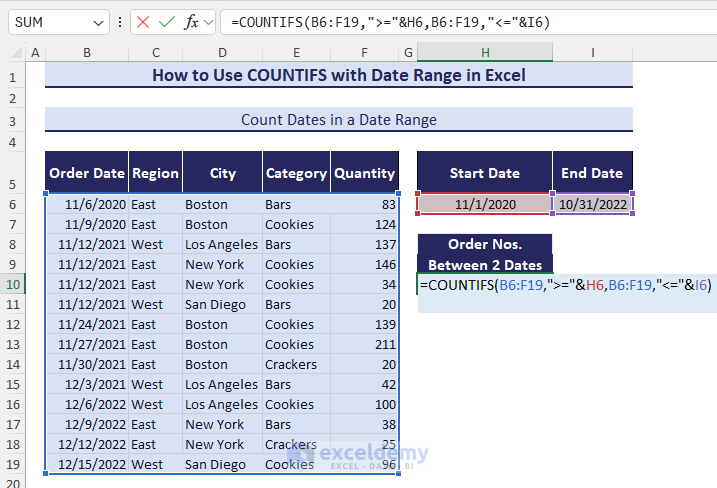
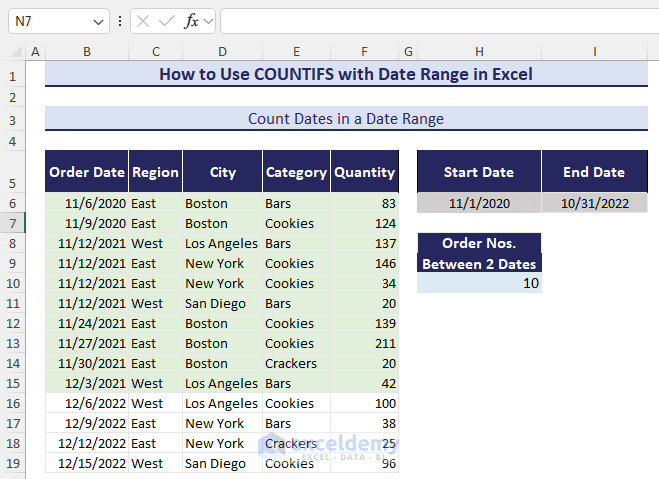
This formula counts the orders within the specified date range.
Note:
If any date occurs more than once, COUNITFS counts all the occurrences, i.e., if 11/6/2020 is recorded twice, COUNTIFS considers both the records in the count.
Case 2 – Counting Occurrence of a Specific Year
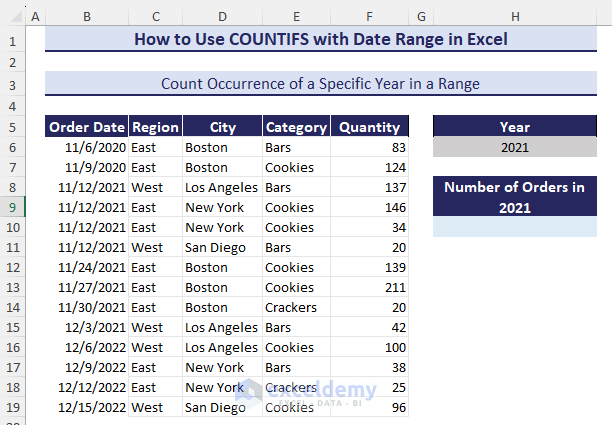
Now let’s count the number of orders made in the year 2021. We’ll use a date range from January 1, 2021, to December 31, 2021.
- Specify the Year:
- In cell H6, enter the year (2021).
- Calculate the Count:
- Choose an empty cell (e.g., H9).
-
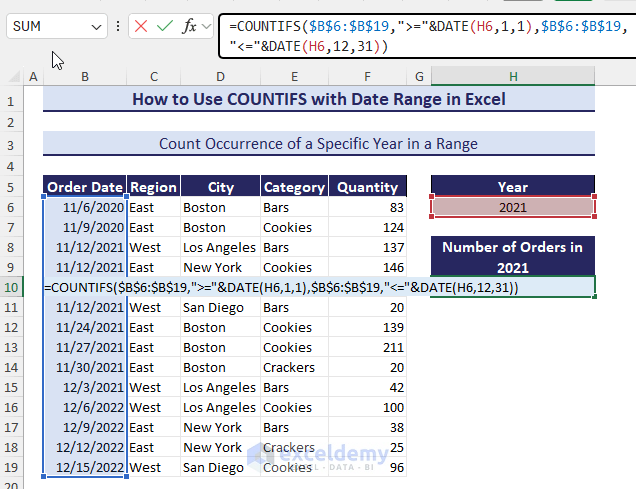
- Insert the following formula:
=COUNTIFS($B$6:$B$19,">="&DATE(H6,1,1),$B$6:$B$19,"<="&DATE(H6,12,31))Here, DATE(H6, 1, 1) and DATE(H6, 12, 31) represent the first and last dates of 2021.
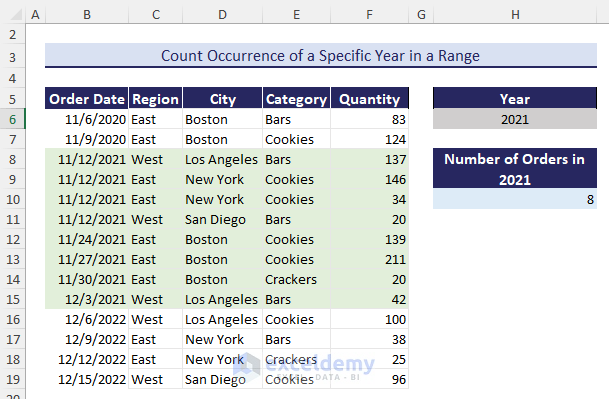
The result in cell H9 will be the number of orders made in 2021.
Case 3 – Counting the Occurrence of a Specific Date in a Date Range
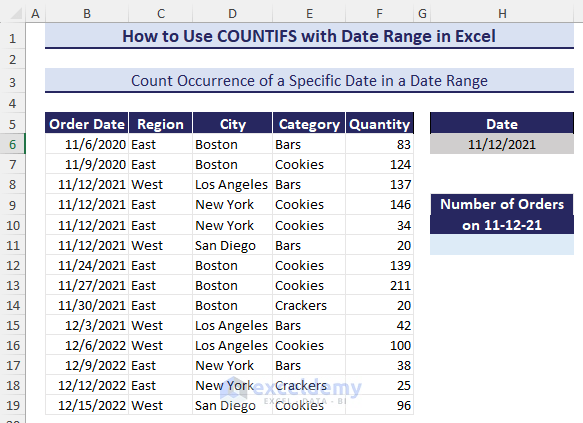
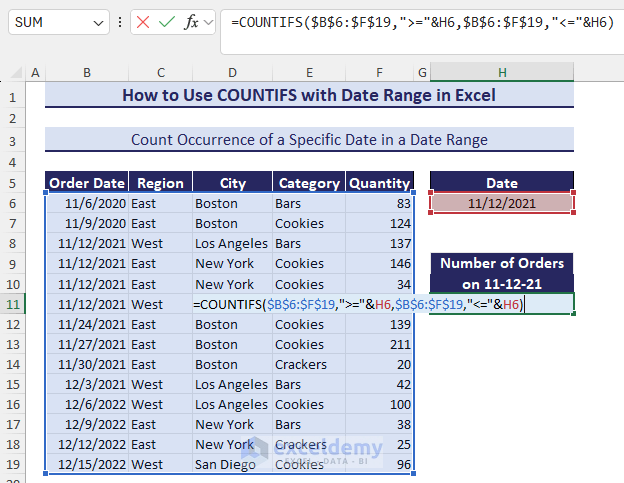
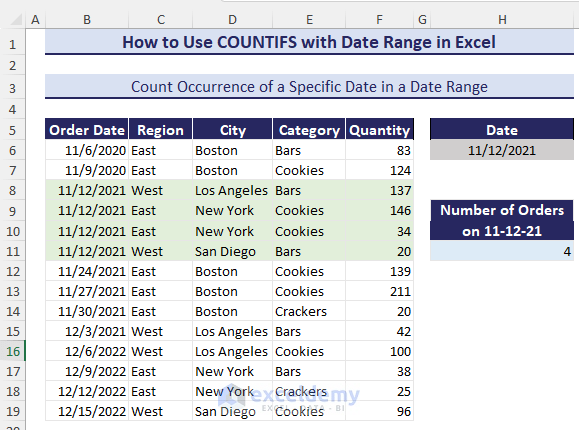
In this scenario, you’ll learn how to use the Excel COUNTIFS function to count the number of orders that occurred on a specific date (e.g., November 12, 2021). Essentially, you’ll determine the occurrence of that specific date within a given date range.
Follow these steps:
- Enter the Target Date:
- In cell H6, enter the date you want to analyze (e.g., “11/12/2021”).
- Calculate the Count:
- In cell H11, insert the following formula:
=COUNTIFS(B6:B19, H6)This formula counts the number of orders that occurred on November 12, 2021.
- Press Enter:
- The result in cell H11 will show the total count of orders for that specific date.
Case 4 – Counting the Dates in a Date Range That Match other Criteria
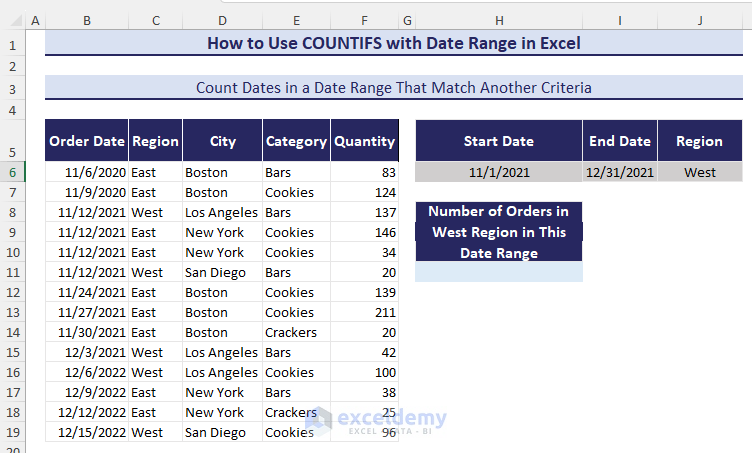
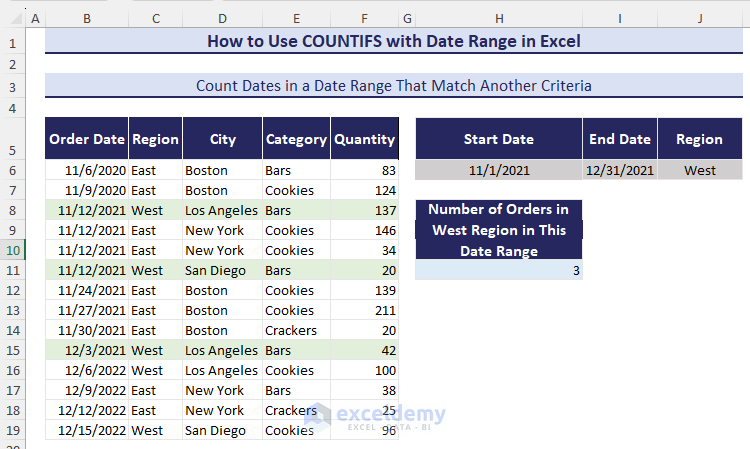
Now let’s explore how to use COUNTIFS to count the number of orders within a date range while considering additional criteria, such as a specific region. For this example, we’ll count the orders in the West region from November 1, 2021, to December 31, 2021.
Follow these steps:
- Specify the Date Range:
- In cell H6, enter the start date of the date range (e.g., 11/1/2021).
- In cell I6, enter the end date (e.g., 12/31/2021).
- Define the Region:
- In cell J6, enter the region for which you want to count orders (e.g., West).
- Calculate the Count:
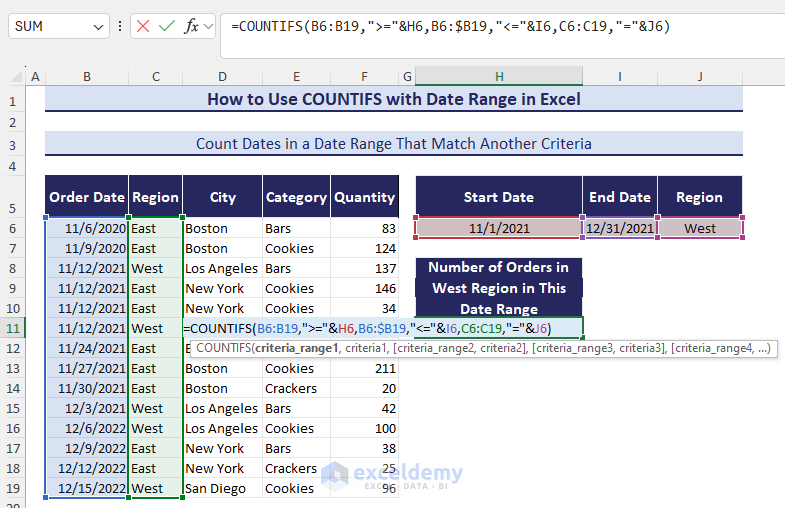
- In cell J6, insert the following formula:
=COUNTIFS(B6:B19,">="&H6,B6:$B19,"<="&I6,C6:C19,"="&J6)This formula counts the number of orders in the West region within the specified date range.
- Press Enter:
- The result will display the total count of orders in the West region during the specified date range.
Read More: How to Use COUNTIFS for 3 Criteria
Download Practice Workbook
You can download the practice workbook from here:
Related Articles
- Advanced Use of COUNTIFS Function in Excel
- Use COUNTIFS for Cells Not Equal to Multiple Text in Excel
<< Go Back to Excel COUNTIFS Function | Excel Functions | Learn Excel
Get FREE Advanced Excel Exercises with Solutions!


What would you do if you wanted to know how many chocolate chip and carrot cookies were sold between two dates?
Greetings Jessica,
Use the SUMIFS function to impose multiple criteria like Product Category, Product, and Dates to find out the total sales of products (i.e., Chocolate Chip or Carrot).
For Chocolate Chips
=SUMIFS(G4:G17,E4:E17,J4,F4:F17,J5,B4:B17,">="&J6,B4:B17,"<="&J7)For Carrot
=SUMIFS(G4:G17,E4:E17,M4,F4:F17,M5,B4:B17,">="&M6,B4:B17,"<="&M7)You can also add all the different sales afterward. Hope, this may help you.
Regards
Maruf Islam (Exceldemy Team)
Hello,
I want to use Countifs function with Date and Time function. I have two different dates and I want to count how many operations (“reading”, “writing”,”dancing”etc) are between two dates and to make some kind of graffic with those dates. I used the following structure:
=Countifs(A4:A20, A20,C4:GL4,”>=”&date(year(b5),month(b5),day(b5)+time(hour(b5),minute(b5),0),c4:cgl4,”<"&date(year(c5),month(c5),day(c5)+time(hour(c5),minute(c5),0)
A – column with activities
c4:GL4 – column with hours (from 01:00 to 24:00 – each fifteen minutes)
b5 – beginning time
c5 – end of time
Thank you in advance!
Hello Mirela,
Thank you for sharing your query. It would be really great if you can send the workbook to [email protected] as It seems quite confusing to create a dataset with the information you shared. After that, I will try to solve your problem. Hope to hear from you soon.
Thanks!