Step 1: Create a Dataset
Here, we will demonstrate calculating the optimal product mix in Excel. Before introducing what is LP, let’s look at the problem we will solve today. Suppose that a computer manufacturing plant produces mice, keyboards, and video game joysticks. The per-unit profit, per-unit labor usage, monthly demand, and per-unit machine time usage are given in the following image.
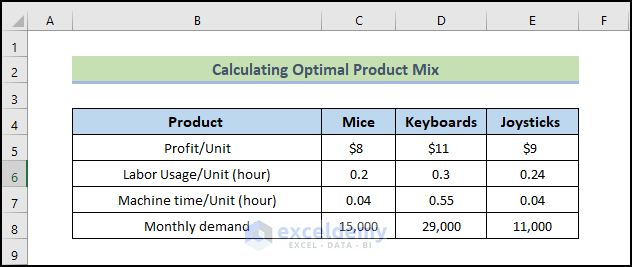
Each month, 13,000 labor hours and 3,000 hours of machine time are available. How can the manufacturer maximize its monthly profit contribution from the plant?
Step 2: Use Linear Programming
Linear Programming (LP) is a technique for optimizing a linear objective function while subject to linear equality or linear inequality constraints. To solve the above problem, we need to develop an LP model by following these steps:
2a. Identify and label decision variable:
In our example, we need to determine how many mice, keyboards, and joysticks will be produced each month.
A = Number of mice to be produced each month
B = Number of keyboards to be produced each month
C = Number of joysticks to be produced each month
2b. Determine the objective and use the decision variable to write an expression for the objective function:
Maximize profit where profit = 8A + 11B+9C
2c. Determine explicit constraints and write a functional expression for each of them:
Explicit constraints are those that are explicitly given in the problem statement.
Labor hour constraint: 0.2A + 0.3B + 0.24C <= 13000
Machine time constraint: 0.04A + 0.55B +0.04c <= 29000
2d. Determine the implicit constraints:
Implicit constraints are not explicitly given in the problem statement. They are typically associated with “natural” or “common sense” restrictions on the decision variable.
Mice: 0 <= A <= 15000
Keyboards: 0 <= B <= 29000
Joysticks: 0 <= C <= 11000
2e. Graph feasible region:
Graph the feasible region by plotting the line associated with each of the linear inequality constraints. Draw in the vector representing the gradient of the objective function. Place a straight edge perpendicular to the gradient vector and move the straight edge in the direction of the gradient vector for maximization (or in the opposite direction of the gradient vector for minimization) to the last point for which the straight edge intersects the feasible region. Compute the resulting optimal value associated with these points.
It is not easy to draw an LP graph with three variables, so I will not show you how to draw the feasible region and compute the solution for the above problem. That’s the very reason why I will introduce Microsoft Excel Solver. It can help you solve an LP problem with more than two variables without drawing an LP graph.
Read More: How to Solve Linear Optimization Model in Excel
Step 3: Activate Excel Solver
Before using the Excel Solver feature, we need to activate it first. You can access Solver by choosing Data ➪ Analyze ➪ Solver. Sometimes it may happen that this command isn’t available; you have to install the Solver add-in using the following steps:
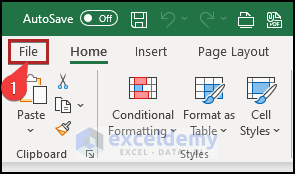
- Choose the File tab.
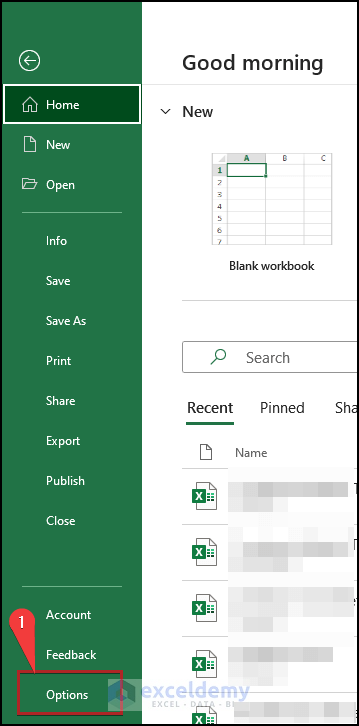
- Select Options from the menu.
- The Excel Options dialog box appears.
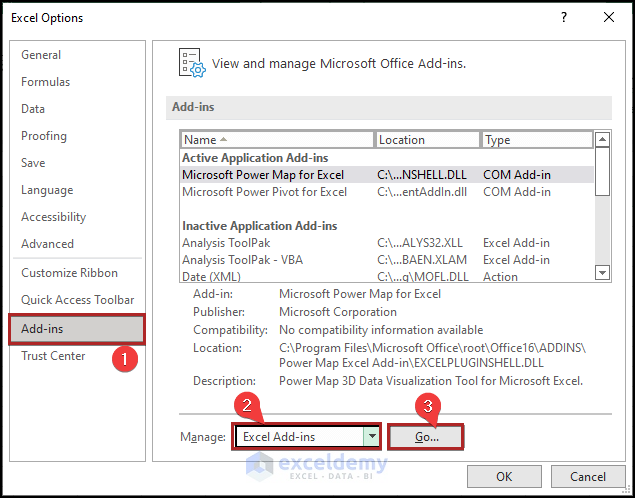
- Go to the Add-Ins tab.
- At the bottom of the Excel Options dialog box, select Excel Add-Ins from the Manage drop-down list and then click Go.
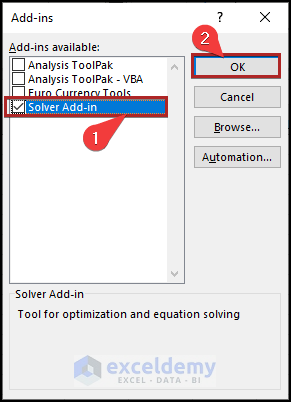
- The Add-ins dialog box appears.
- Place a checkmark next to Solver Add-In, and click OK.
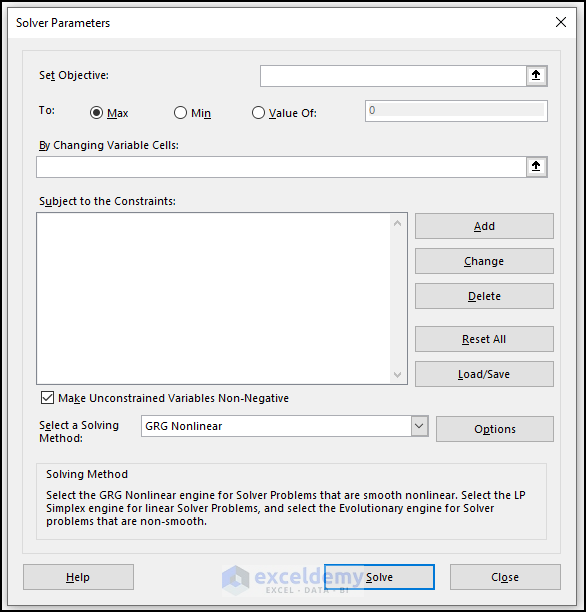
To run Excel Solver, click on Solver in the Analysis group. A Solver Parameters dialog box will be prompted. You can see that three essential parts need our input: Set Objective, Changing Variable Cells, and Subject to the Constraints. When looking back at the LP model, you will find that the Set Objective represents our objective (maximize profit in our case). Changing Variable Cells represents a decision variable we can adjust or change to optimize our objective. And Subject to the Constraints requires us to add explicit or implicit constraints.
Step 4: Input Problem into Worksheet Cells
We will use the SUMPRODUCT function to calculate some parameters. The following image shows you how to extract information and put it into worksheet cells, as Excel can only manipulate worksheet cells.
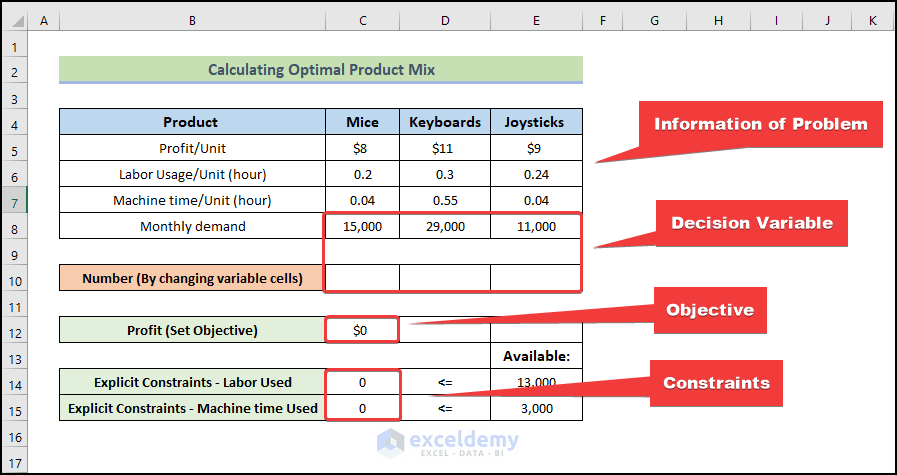
This range from C5:E8 includes essential information about our problem. Cells C10, D10, and E10 represent the number of mice, keyboards, and joysticks produced monthly. Since these numbers are to be decided, and thus, the range C10:E10 will be left blank at the moment. Cell C10 was filled with a formula to compute the profit. Here, you can see that the formula will be extremely complex if we have a lot of products.
In cells C14 and C15, we use formulas to compute the labor and machine time used. Please note that cells C12, C14, and C15 values are all 0. That is because Excel treats values in blank cells (C10, D10, and E10) as 0. Another thing that needs your attention is the relationship between cells in the red square. The amount produced of each product should be less than or equal to the demand for that product. Therefore, the value in cell C10 should be less than or equal to that in cell C8. This logic is also applied to cells D10 and D8. Of course, the value in cell E8 cannot be less than the value in cell E10, either.
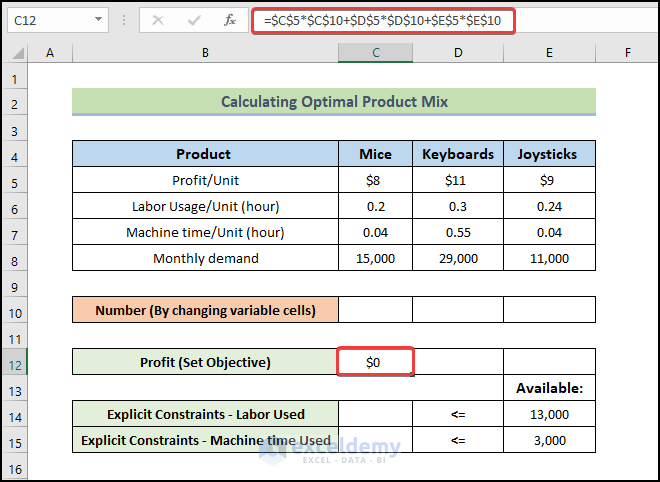
- We will be setting some necessary formulas. To calculate profit, enter the following formula:
=$C$5*$C$10+$D$5*$D$10+$E$5*$E$10
- Press Enter.
To calculate the Explicit Constraints – Labor Used,
- Enter the following formula:
=SUMPRODUCT($C$6:$E$6,$C$10:$E$10)
- Press Enter.
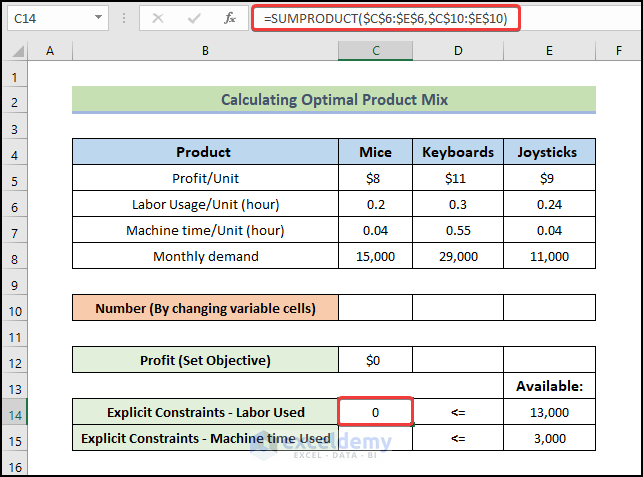
To calculate the Explicit Constraints – Machine time Used,
- Enter the following formula:
=SUMPRODUCT($C$7:$E$7,$C$10:$E$10)
- Press Enter.
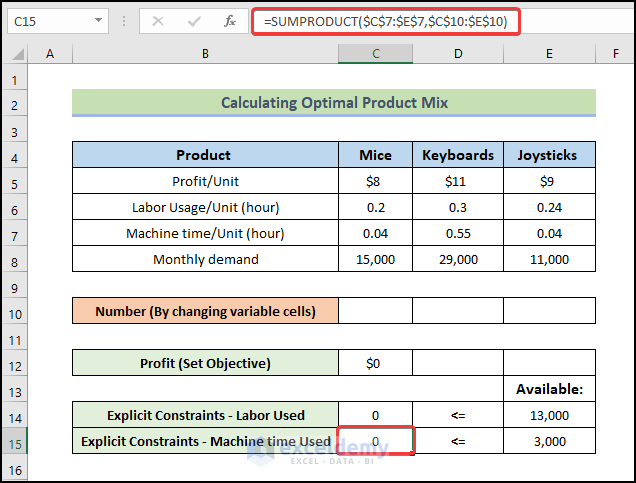
Read More: How to Solve Network Optimization Model in Excel
Step 5: Use Excel Solver to Solve the LP Problem
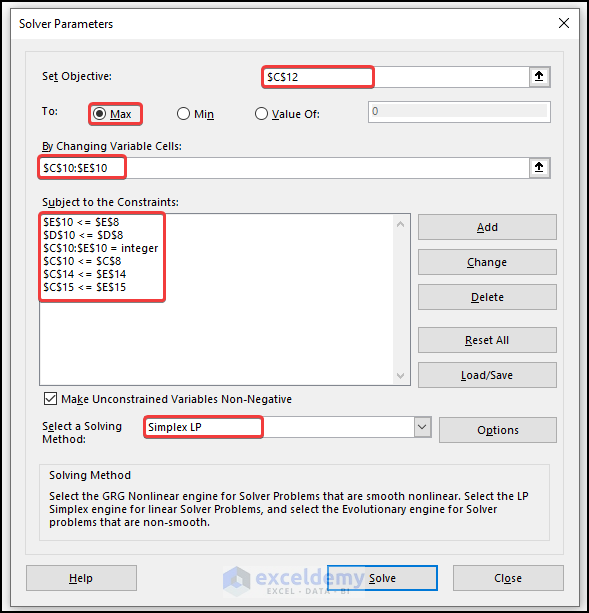
Click on Solver in the Analysis group to open the Solver Parameters dialog box. Fill “$C$10” in the Set Objective field and “$C$8:$E$8” in the By Changing Variable Cells field.
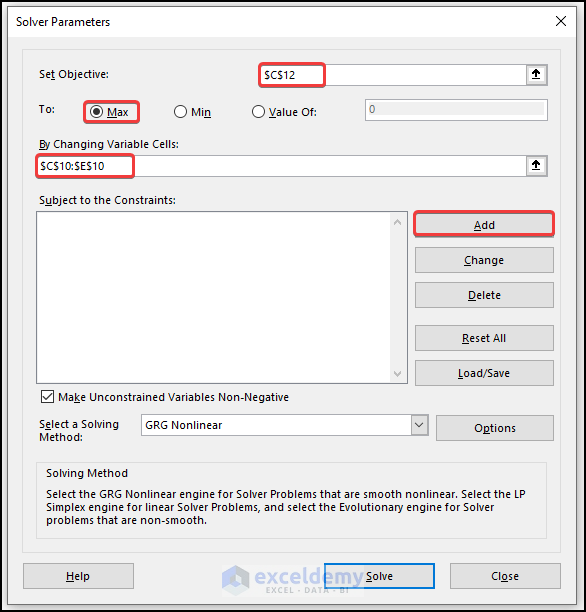
- To add constraints in the Solver Parameters dialog box, click Add to open the Add Constraint dialog box. In the prompted dialog box, fill in our first explicit constraint – labor used must be less than or equal to 13,000.
- Click OK to finish.
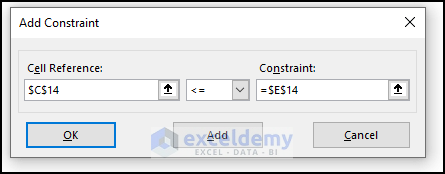
- Use the same approach to add our second explicit constraint and implicit constraint discussed in section 4: The amount produced of each product should be less than or equal to the demand for that product.
- To add one implicit constraint, each product’s amount should be non-negative. Select the “Make Unconstrained Variable Non-Negative” check box. This can ensure that all the changing cells are forced to be greater than or equal to 0. Since our constraints can be represented by linear relationships, we will choose Simplex LP in the Select a Solving Method field.
- The Solver Parameters dialog box will look like the below:
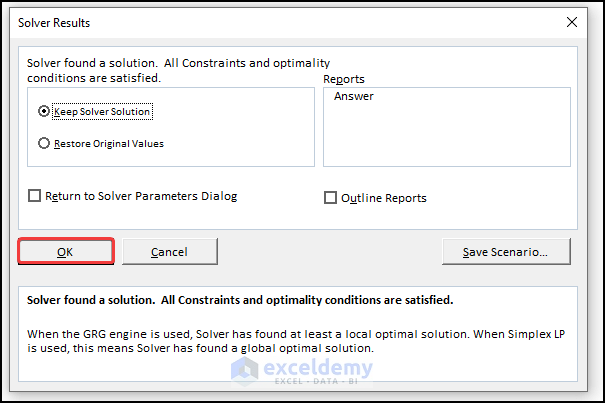
- Click on the Solve button. The following figure shows the Solver Results dialog box.
- Click OK, and your result will be displayed.
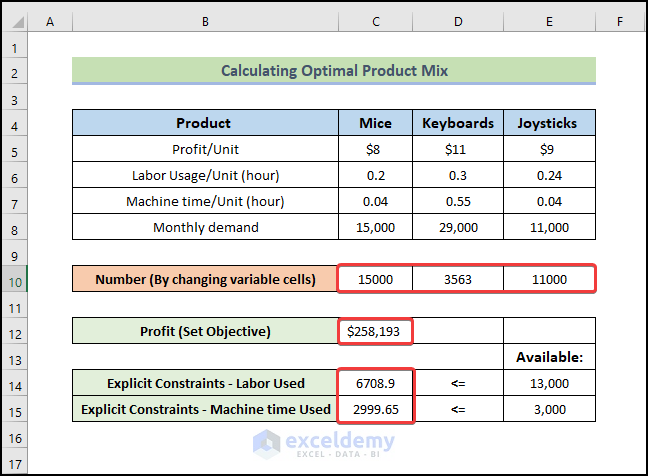
- After we click on the Solve button, the solver will return the solution. You can see that cells C10:E10 are no longer blank, and the values in cells C12, C14, and C15 are no longer 0.
- It states that you can maximize your profit by producing about 15,000 mice, 3563 keyboards, and 11,000 joysticks. Your maximum profit will be $258,193.
Note: Excel does not always have a solution. You might need to change your constraints to get a solution in this situation.
Read More: How to Perform Multi-Objective Optimization with Excel Solver
Download the Practice Workbook
Download this workbook to practice.
Related Articles
<< Go Back to Optimization in Excel | Solver in Excel | Learn Excel
Get FREE Advanced Excel Exercises with Solutions!

