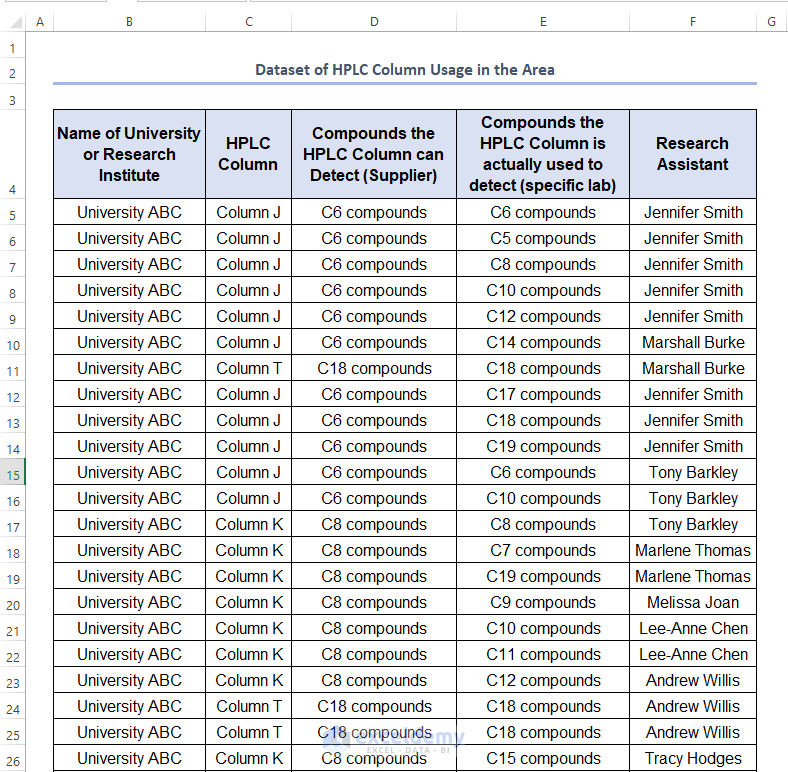
The sample dataset contains 200 rows of data with 5 columns.
Method 1 – Using Advanced Filter
Excel Advanced filter helps you to extract data based on specified criteria. You can use the Excel Advanced filter to get unique values for certain conditions.
Steps:
- Open a blank spreadsheet named Using Advanced Filter.
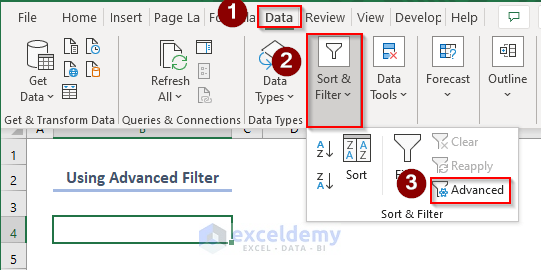
- Go to Data > Sort & Filter > Advanced.
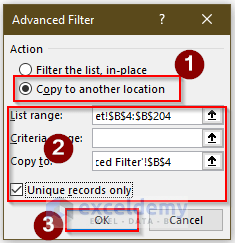
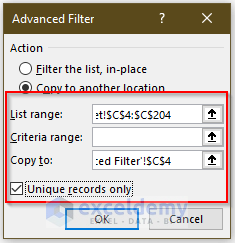
- In the Advanced Filter window, select the Copy to another location.
For the Copy to option, select $B$4 on the Advanced Filter sheet and tick only unique records. - Select the List range then navigate to the dataset sheet and select column $B$4:$B$204, which is our Name of University or Research Institute
- Click OK.
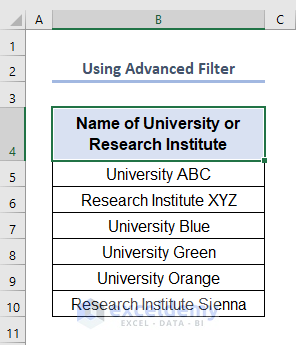
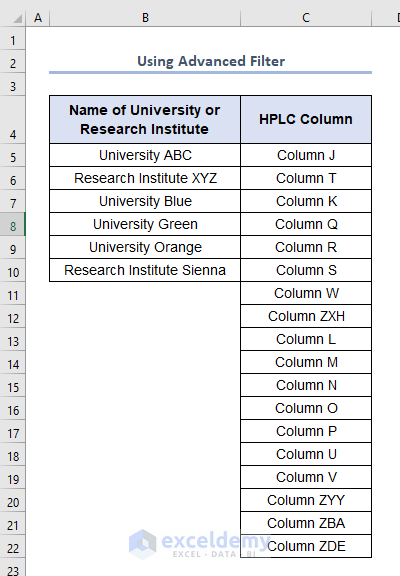
- The unique university and research institute names will be extracted.
- Follow the same process for all the other columns in the original dataset.
- Edit the Advanced Filter window as shown in the image below to find the unique value of the HPLC Column.
You will get the following output.
Method 2 – Removing Duplicates to Find Unique Values in Excel
Steps:
- Make a copy of the Original Dataset sheet and give it a unique name. We named the copy Removing Duplicates to Get Unique Values.
- Select the range and go to Data > Data Tools > Remove Duplicates.
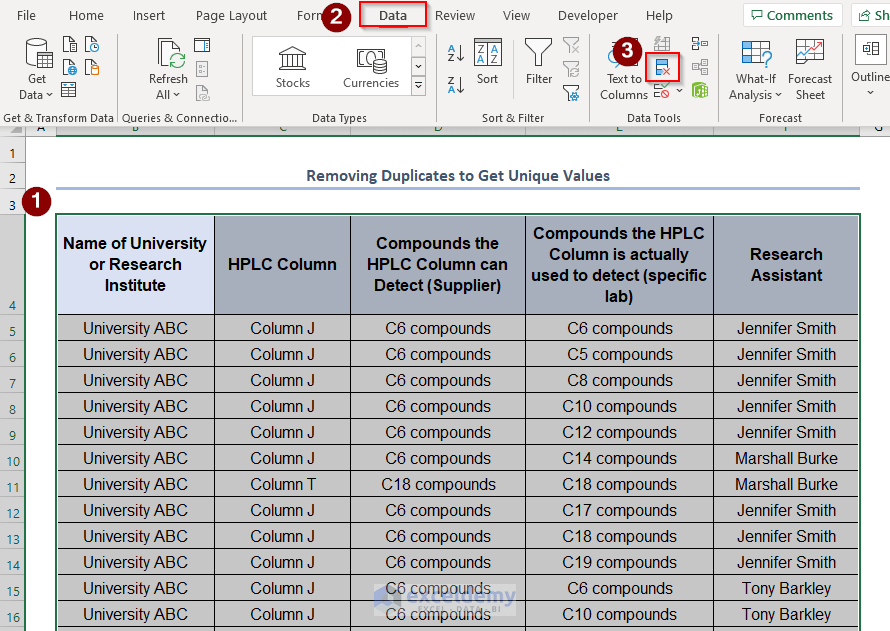
- A Remove Duplicates window will pop up.
- Ensure that the My data has headers checkbox is ticked, choose the column that you’d like the duplicates to be removed from or leave all the columns checked.
- If you choose to remove duplication for one particular column in the dataset, you’ll get the same results as for the Advanced Filter, unique extracts example above.
- For example, choose the Name of University or Research Institute as shown below.
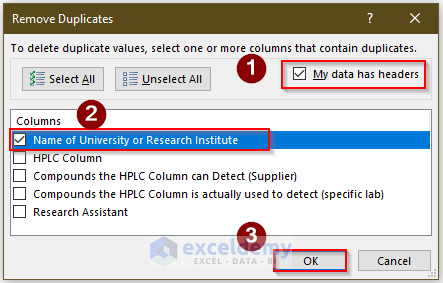
- The result will be displayed in a dialog box, showing that based on the Name of University or Research Institute column 171 duplicate values were removed and 6 unique values remain.

- This confirms the Advanced Filter results and additionally highlights the number of duplicate values, within this specific column.
- Removing duplicates and ensuring all the columns are checked as shown below.
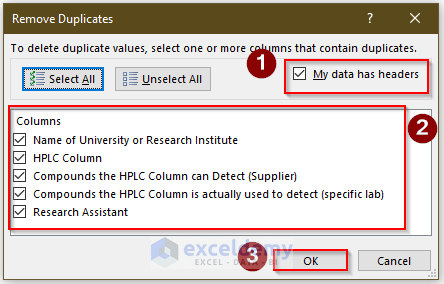
- This result in Excel returning an answer that says that there were 3 duplicate values and 197 unique values. This means that there were three rows in the dataset where the values for Name of University or Research Institute column, HPLC Column column, Compounds the HPLC Column can Detect (Supplier) column, Compounds the HPLC Column is actually used to detect (specific lab) column and Research Assistant column were all equal.
- We will look at the data in context and find out, outside of the Research Assistant column, how many values are duplicated.
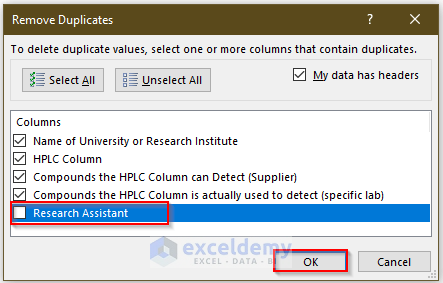
- We will get 22 duplicate values found and removed, 178 unique values remain in the dataset as shown below.

- Click OK to get the unique values.
Method 3 – Using Excel Formula
3.1. Using EXACT Function with Conditional Formatting
Steps:
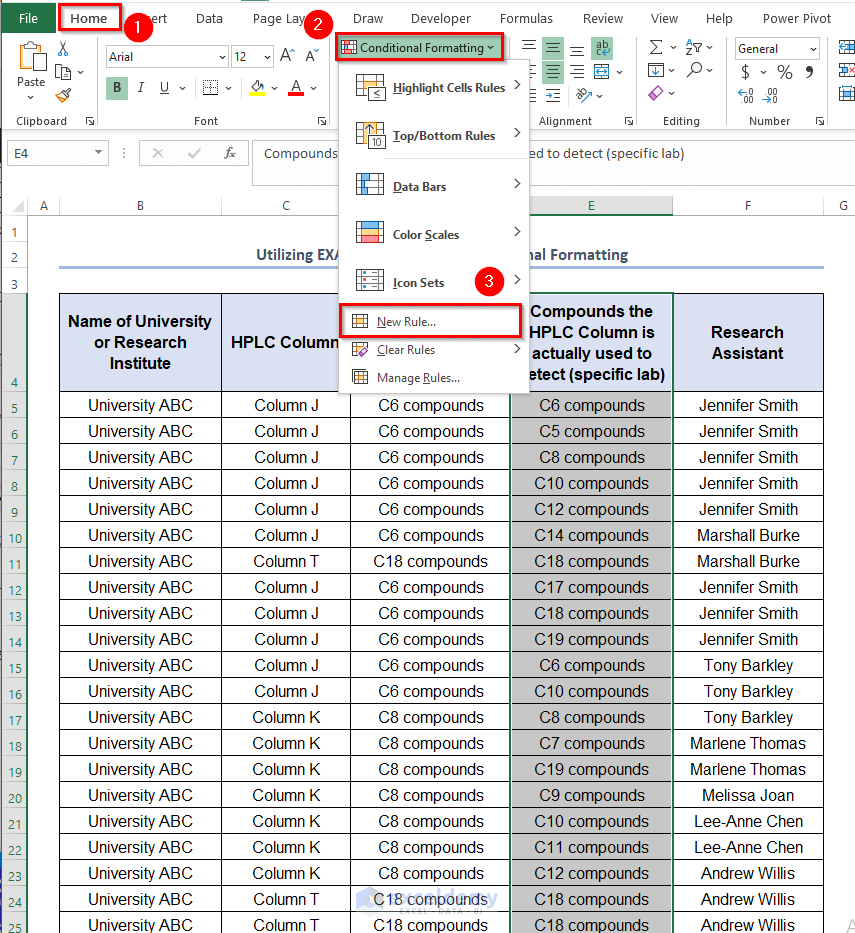
- Highlight the Compounds the HPLC Column is actually used to detect (specific lab) column.
- Select the following, Home > Styles > Conditional Formatting. Select New Rule from the drop-down options given.
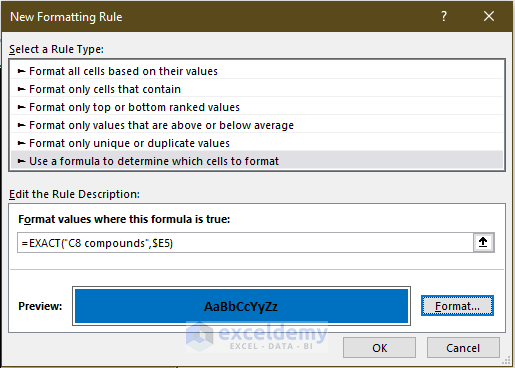
- In the Format values where this formula is true: text box, enter the following formula:
=EXACT("C8 compounds",$E5)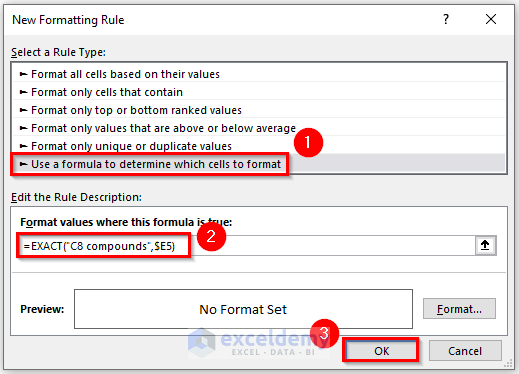
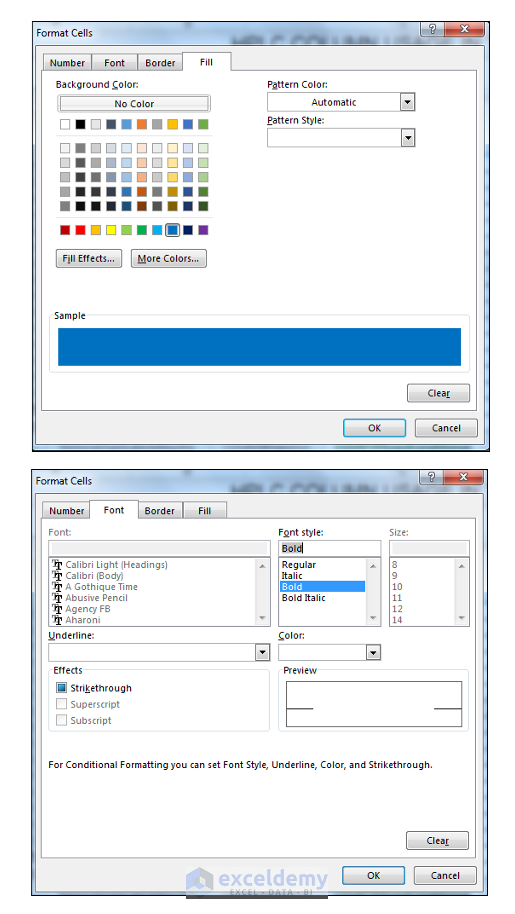
You need to format before clicking OK.
- Choose a dark blue fill, with white bold text from the options given, as shown below.
- Click The preview displays what the formatting will look like.
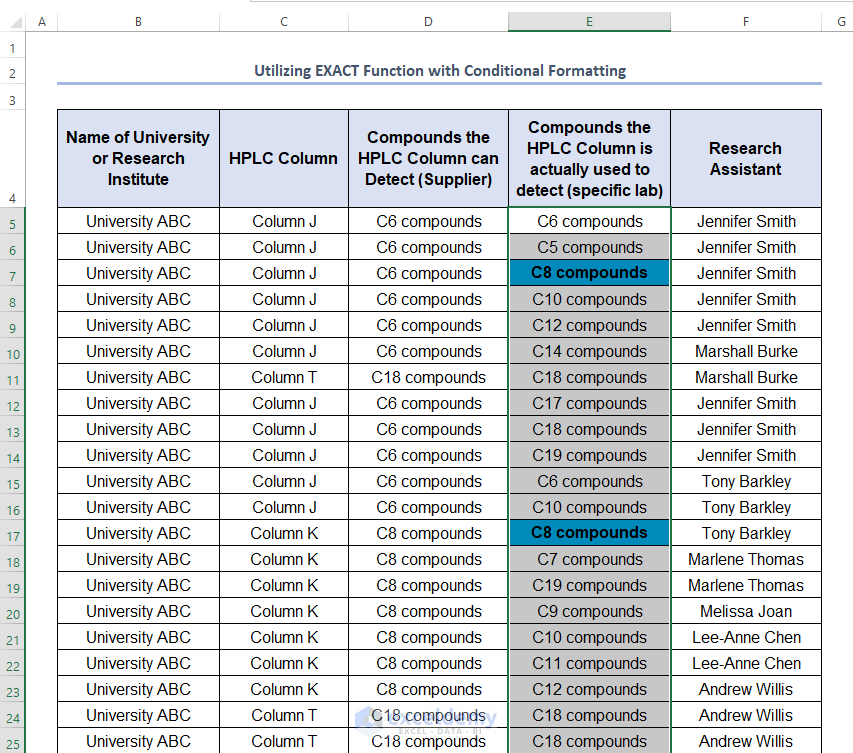
- Click OK. The output will be as shown in the following image.
3.2. Utilizing UNIQUE Function
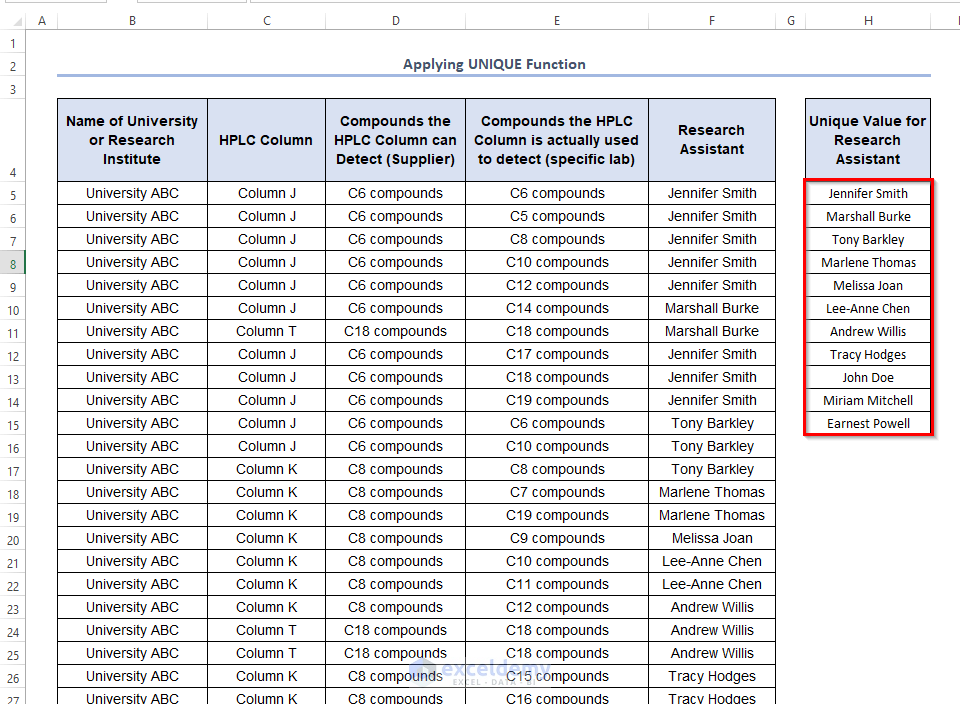
To find the unique value of the Research Assistant column header.
- Enter the following formula in the H5.
=UNIQUE(F5:F204)F5:F204 is the range of cells of the Research Assistant Column.
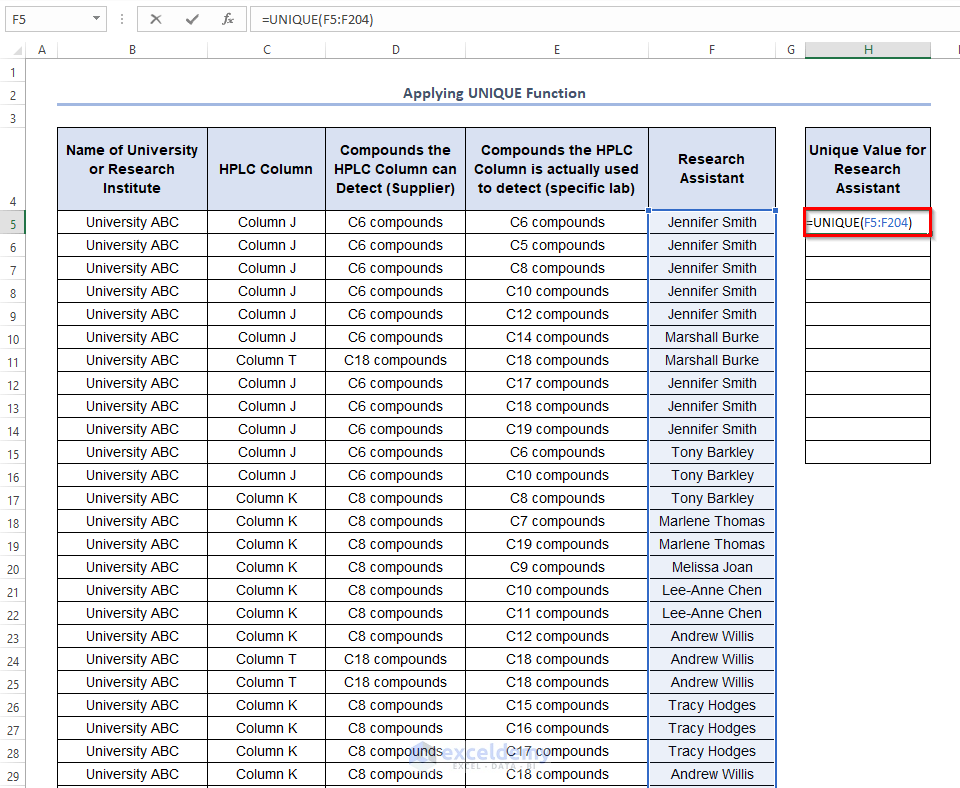
- Press ENTER to get the filtered Research Assistants.
Method 4 – Utilizing Built-in Feature
Steps:
- Make a copy of the sheet containing the original data.
- With a cell in the dataset selected, press CTRL + T on your keyboard or go to Insert > Tables > Table.
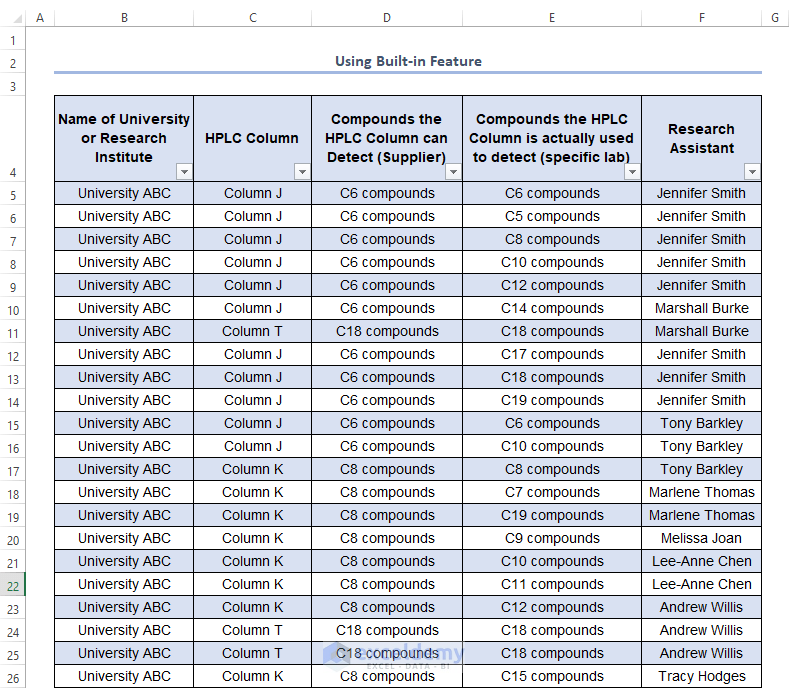
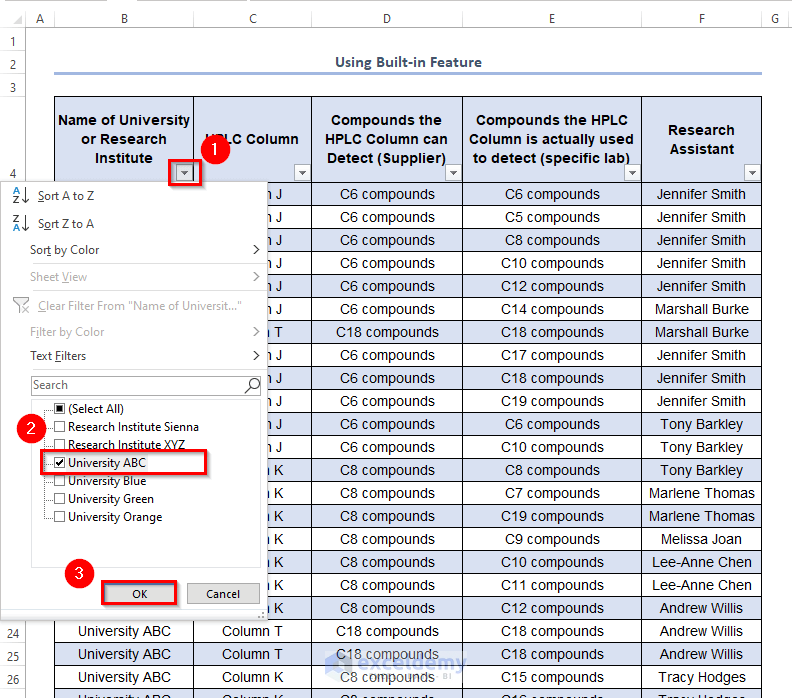
- Using the filtering options on the table also allows for the isolation of certain values. Clicking on the drop-down arrow next to the Name of University or Research Institute column, allows one to select certain universities. Ticking just University ABC isolates all the records for University ABC in the data set as shown below.
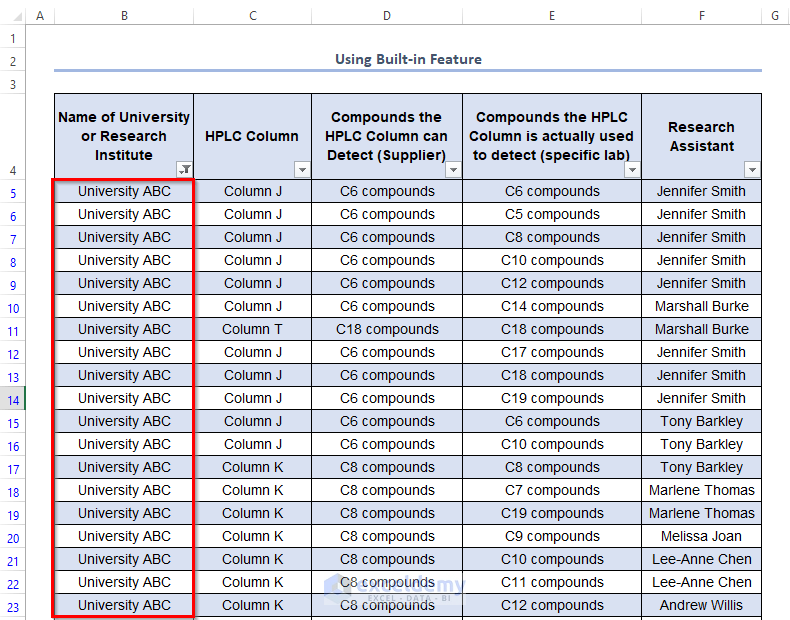
- You’ll get an output with the unique names of universities.
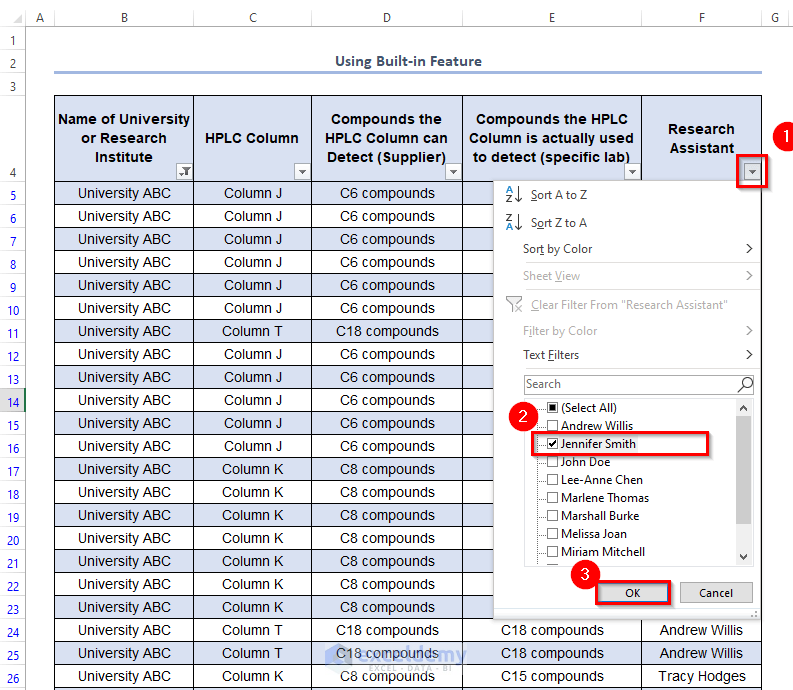
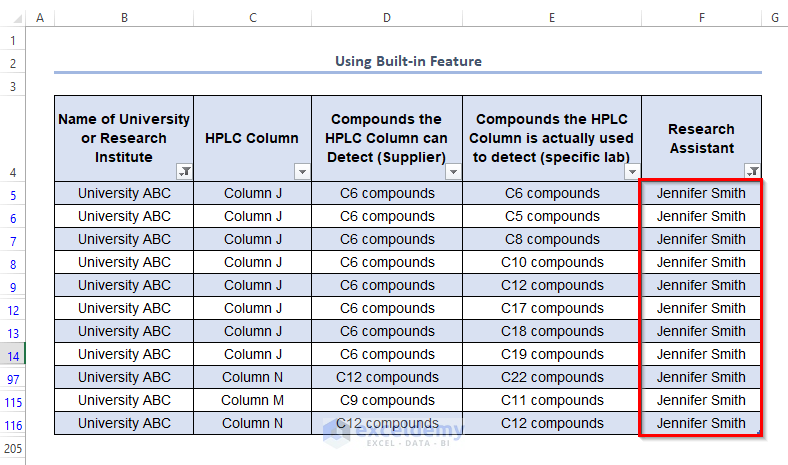
- You can also filter a table using more than one column. For example, we want to see only the records in the table from University ABC, which research assistant Jennifer Smith compiled. We will first have to tick University ABC as in the above example then click the drop-down arrow next to the Research Assistant column and select Jennifer Smith.
- You will find unique Research Assistants.
Method 5 – Using Slicers with Tables
Steps:
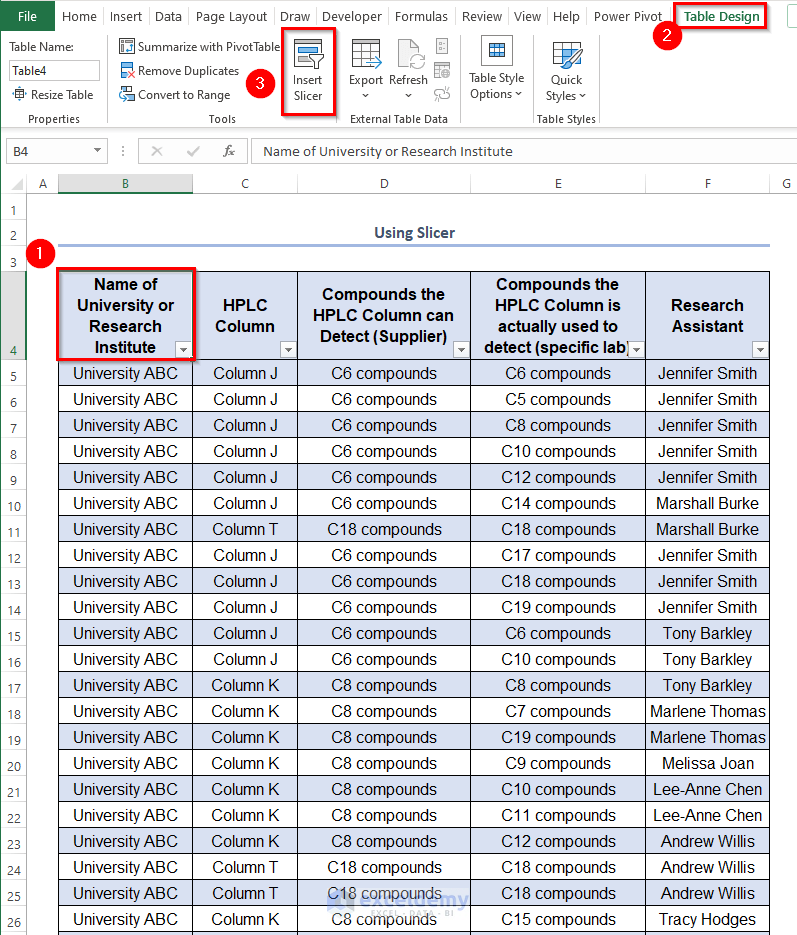
- In order to insert a slicer, select a cell in the table and go to the Design tab in the Table Tools context-sensitive menu > Tools > Insert Slicer.
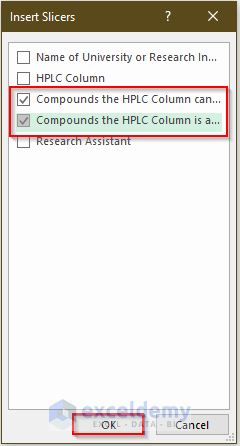
- In the Insert Slicers dialog box, tick the Compounds the HPLC Column can Detect (Supplier) column and the Compounds the HPLC Column is actually used to detect (specific lab) column.
- The slicers will be inserted as shown below.
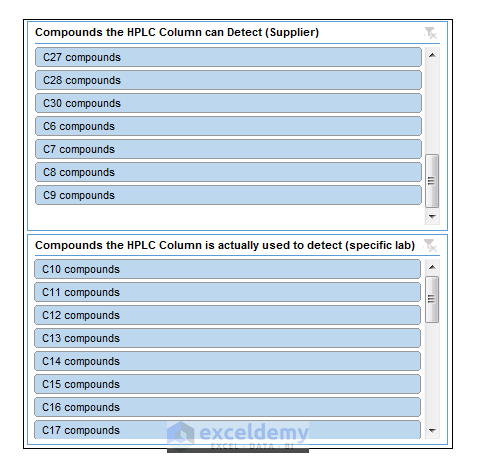
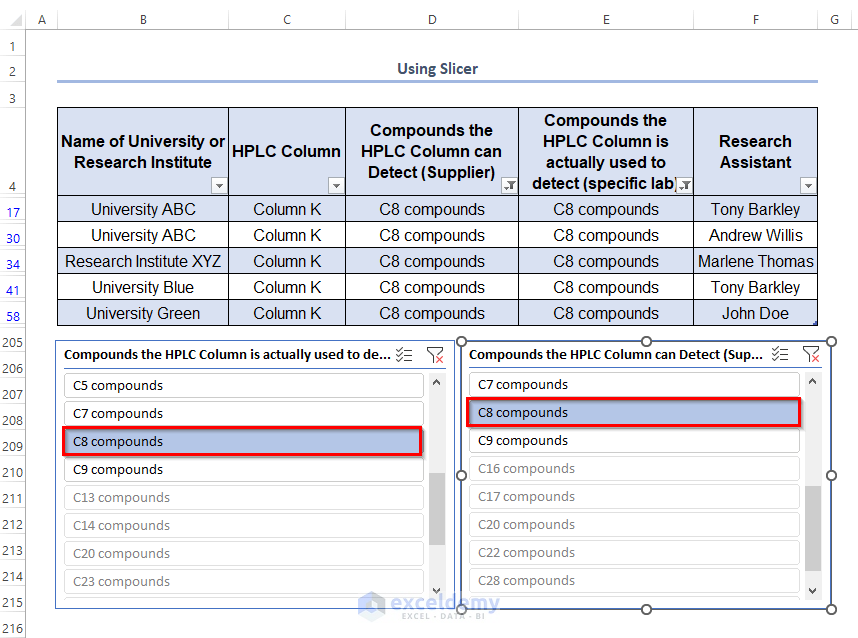
- Selecting C8 compounds from the Compounds the HPLC Column can Detect (Supplier) slicer, filters the table instantly to show only the rows where you have listed C8 compounds.
- Choose C8 compounds again in the Compounds the HPLC Column is actually used to detect (specific lab) We want to check where the value repeats in order to see which labs are actually following the specifications set by the supplier.
How to Find Unique Values from Multiple Columns in Excel
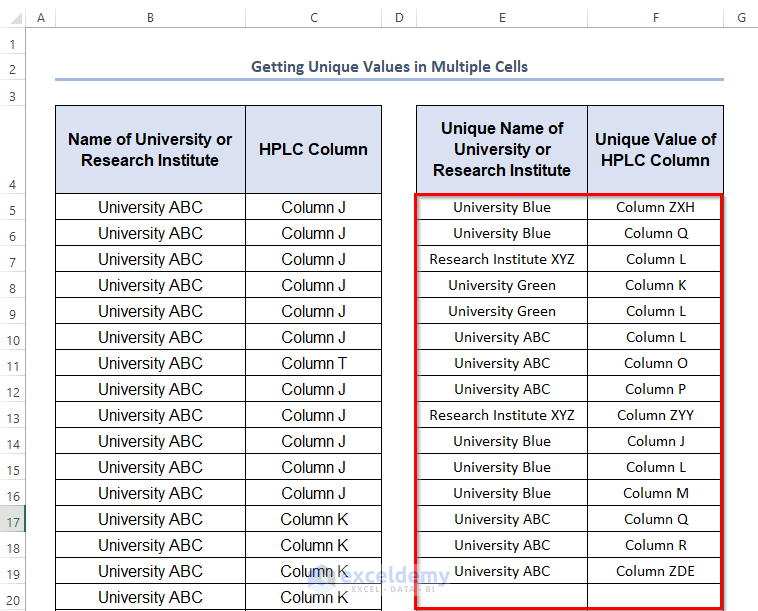
The UNIQUE function can find the unique value of multiple columns.
- To find the unique values from columns B and C, enter the following formula in the E5
=UNIQUE(B5:C204,FALSE,TRUE)B5:C204 refers to the range of cells Name of Universities or Research Institute and HPLC Columns.
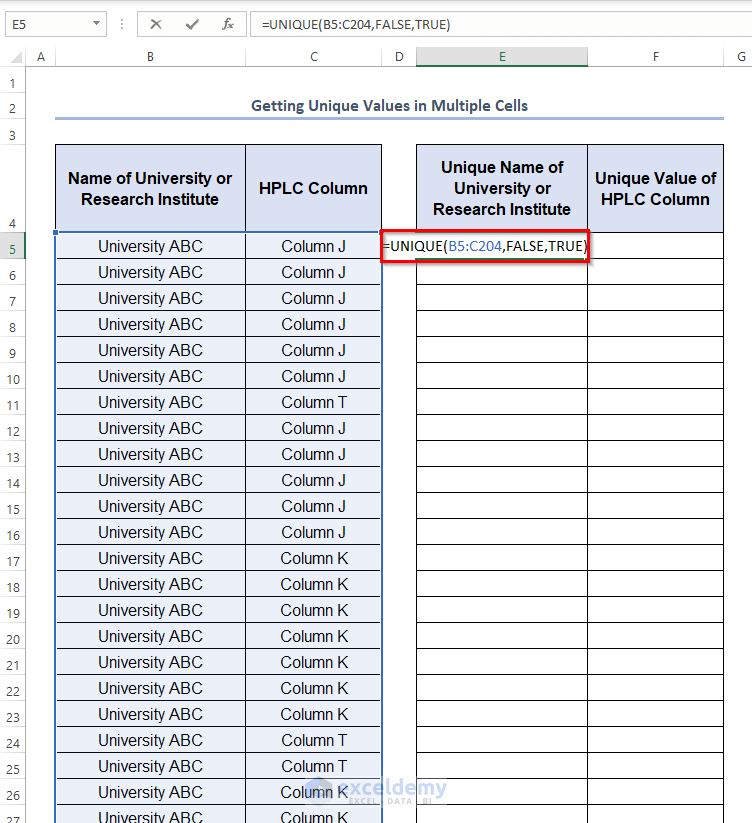
- Press ENTER.
You will get an output as shown in the following image.
How to Count Unique Values in Excel
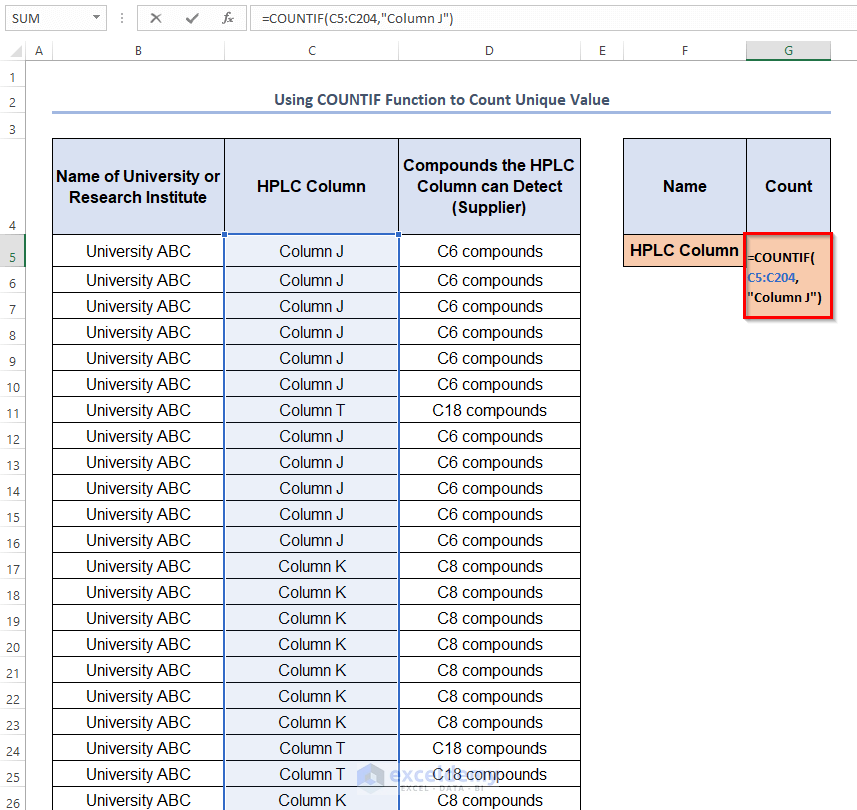
You can count the unique values in columns or rows if you use the COUNTIF function. The COUNTIF function doesn’t show unique values rather it counts the number of them and shows the counted number.
- To find the number of unique values of Column C, enter the following formula in cell G5.
=COUNTIF(C5:C204)
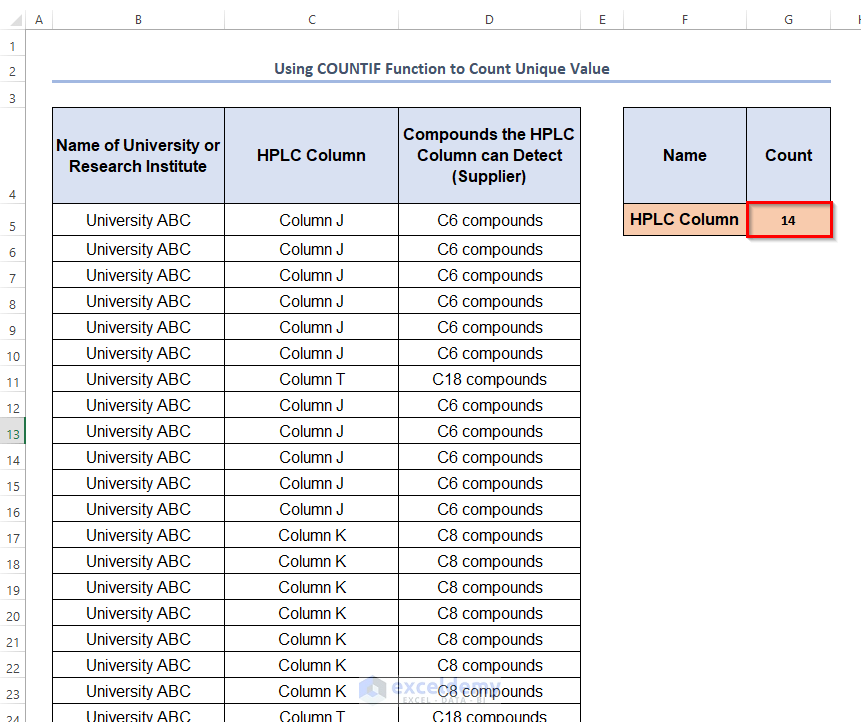
- After pressing ENTER, you’ll get the output as 14.
Download Practice Workbook
<< Go Back to Learn Excel
Get FREE Advanced Excel Exercises with Solutions!

