Search results for: power pivot
Aug 8, 2024
A DAX code will be used to find average sales, commission, success rate of broker calls, and the greatest number of calls.
Download ...
Aug 2, 2024
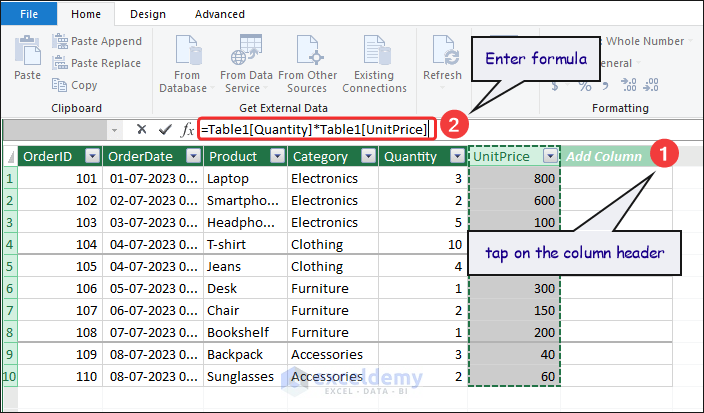
Here's an overview of Power Pivot formulas:
Download the Practice Workbook
Using Formula in Power Pivot.xlsx
Understanding ...
Jul 28, 2024
PivotTable - Basic Things
A PivotTable is a powerful data analysis tool in Microsoft Excel. It allows users to quickly summarize, organize, and gain ...
May 29, 2024
The pivot table feature in Microsoft Excel can be used to sort, analyze, and share data, but pivot tables do not calculate median values, which can ...
Jul 15, 2024
What Is a Data Model?
In simple terms, a Data Model enables us to combine information from many tables to create a relational data source within an ...
Jul 5, 2024
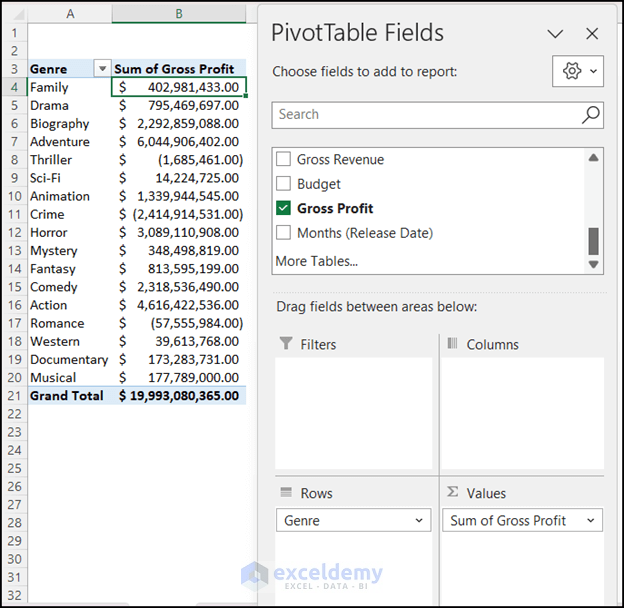
Method 1 - Creating Implicit Calculated Field in Pivot Table Data Model
Step-01: Creating Pivot Table
Go to the Insert tab >> PivotTable ...
Jun 6, 2024
Method 1 - Select Dataset
Select the whole dataset or the part of the dataset you want to convert into a pivot table. This stage's selection will go ...
Aug 14, 2024
This is the sample dataset.
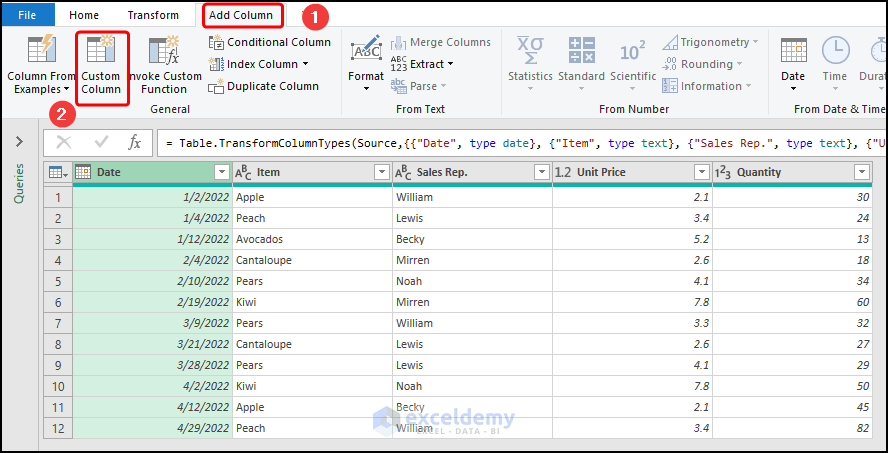
Step 1 - Add the Dataset to the Data Model
Select the entire dataset B4:E12.
Go to Power Pivot
...
Jun 6, 2024
Power Pivot is primarily used for managing data tables and the relationships between them, which makes it easier to analyze data from several tables. ...
Jun 24, 2024
We have a dataset containing the company’s customer information about payment methods and amounts. We will create a pivot table from this dataset and ...
Jul 26, 2024
What Is a Pareto Chart?
A Pareto chart combines columns sorted in descending order with a line representing cumulative total percentages. It’s a ...
Jul 15, 2024
What Is Pivot Chart?
Pivot charts are a powerful way to visualize summarized data from a pivot table. They help illustrate comparisons, patterns, ...
Jul 5, 2024
Method 1 - Using Excel Power Query Editor to Consolidate Multiple Worksheets into One PivotTable
Steps:
Use the following sheets for ...
Jun 27, 2024
Method 1 - Auto Refresh Pivot Table Without VBA While Opening File
Steps:
Select any data from the dataset.
Click as follows: Insert > ...
Aug 2, 2024
In this tutorial, we will describe how to convert columns to rows in Excel using Power Query.
What is Power Query in Microsoft Excel?
Power ...