
Pivot Tables are powerful for data analysis, and with advanced techniques like Calculated Fields and Multiple Data Sources, you can unlock even more insights. In this article, we will explain and show advanced Pivot Table techniques, focusing on Calculated Fields and using Multiple Data Sources in Pivot Table.
Creating Calculated Fields in Pivot Tables
Calculated Fields create custom calculations within the Pivot Table based on the existing data. Calculated fields add a new column to the Pivot Table, where the values are derived from existing fields. This is useful when you want to perform calculations on your data without modifying the original dataset.
Let’s calculate a 10% commission on sales from the sales dataset by using the Calculated Field in the Pivot Table. To use the calculated field you need to create a Pivot table first.
Step 1: Create a Pivot Table.
- Select your data range.
- Go to Insert tab >> select Pivot Table.
- Choose where to place your Pivot Table (New Worksheet/Existing Worksheet).
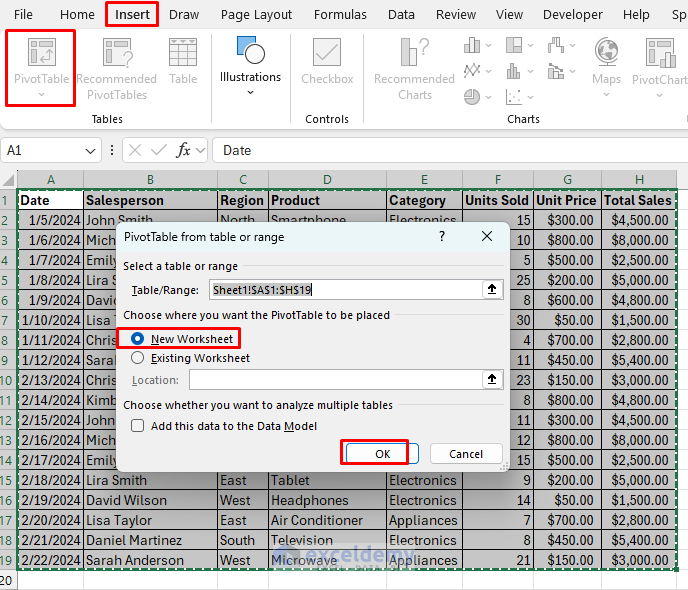
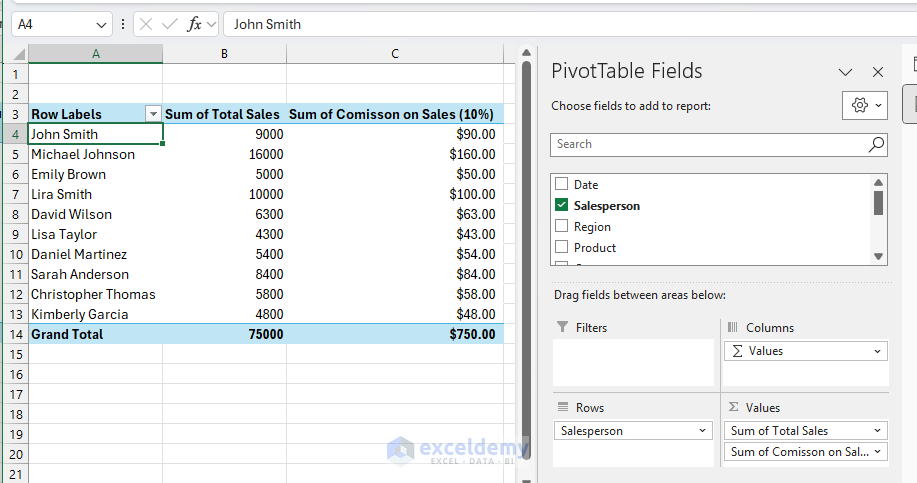
Now, drag and drop the necessary fields into the Rows, Columns, Values, and Filters sections.
Step 2: Insert a Calculated Field.
- Click anywhere inside your Pivot Table.
- Go to the PivotTable Analyze tab >> from Fields, Items & Sets >> select Calculated Field.

- In the Insert Calculated Field dialog box:
- In the Name box, enter a name for your calculated field: Commission on Sales (10%)
- In the Formula box, insert the following formula:
- = 0.01 * ‘Total Sales’
- Select Add >> click on OK to add the field to your Pivot Table.
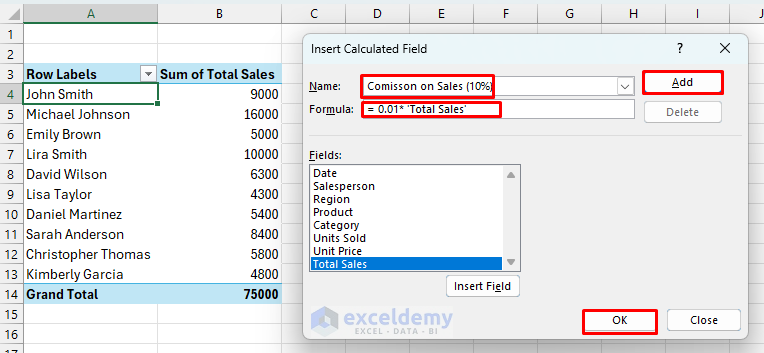
Now the new Calculated Field Commission on Sales (10%) column will be added to the Pivot Table.
Tip: Calculated Fields work best for additive calculations, but for non-additive or more complex calculations, use Power Pivot.
Creating Pivot Tables from Multiple Data Sources
Combining data from multiple tables (or sources) in a single Pivot Table lets you analyze more comprehensive datasets without merging tables manually.
Let’s assume you have multiple data sources one is Sales data containing sales information and another is Product data containing product information. We will show how you can use these multiple data sources in the Pivot Table.
Method 1: Using Excel’s Built-In Data Model
By using the Data Model feature you can use multiple data sources in Pivot Table. Excel 2013 and later versions offer this built-in Data Model feature.
Step 1: Set Up Each Table in Excel.
- Select the cell range >> go to the Insert tab >> select Table.

- For better understanding, you can name each table (e.g., Sales_Data for the Sales table and Products_Table for the Products table).
Step 2: Insert a Pivot Table Using the Data Model.
- Select the Table >> go to Insert tab >> select PivotTable.
- In the Create PivotTable dialog box,
- Choose where to place your Pivot Table (New Worksheet/Existing Worksheet).
- Click on Add this data to the Data Model.
- Click OK.

Step 3: Create Relationships.
- Go to the Data tab>> from Data Tools >> select Relationships.
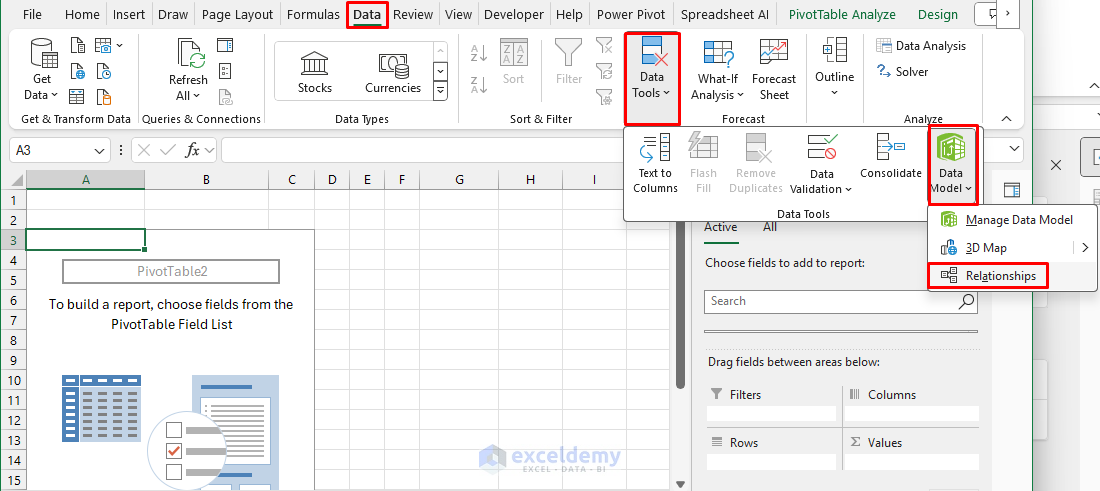
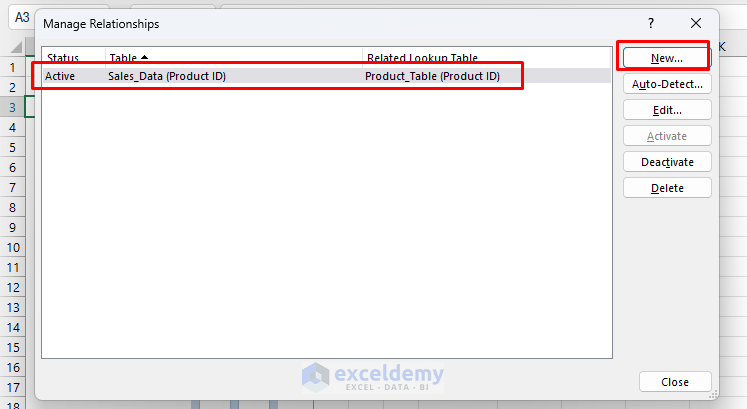
- In the Manage Relationships dialog box:
- Click New, then select Product_ID from both the Sales and Products tables to establish a relationship.
- Click OK to save the relationship.
Step 4: Build the Pivot Table.
- Now, in the PivotTable Fields pane, you’ll see fields from both tables.
- Drag Category and Product from the Product_Table to Rows.
- Drag Unit sold from Sales_Data table to Columns.
- Drag Total Sales from the Sales_Data table to Values to see total quantity and sales by product.
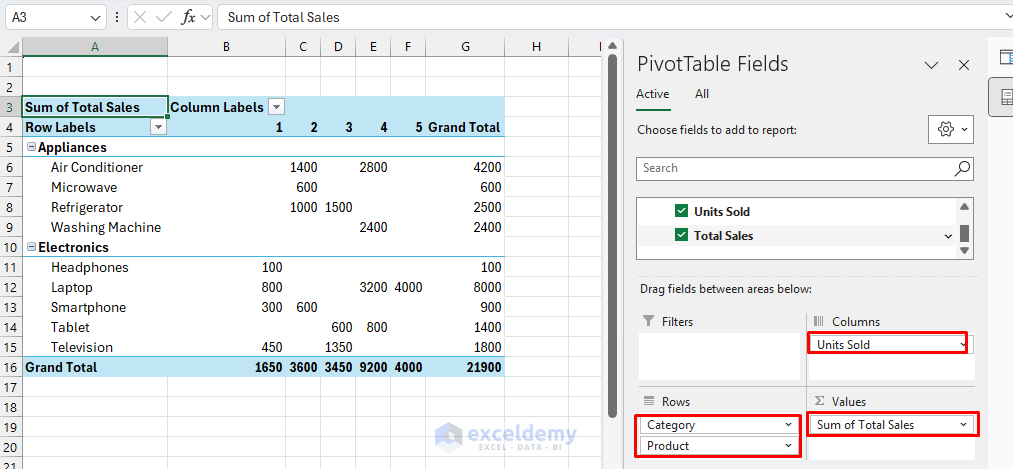
With the relationships set up, your Pivot Table can now pull fields from both tables, showing sales summaries, product names, and categories without requiring manual merging.
Method 2. Using Power Pivot for Multiple Data Sources
Excel’s Power Pivot add-in is available in versions like Excel 2016, 2019, and Office 365 Professional & Enterprise which allows you to create relationships between tables from different sources. This approach enables you to create a Pivot Table based on multiple tables and perform analysis across them.
Step 1: Enable Power Pivot (if not already enabled).
- Go to File tab >> select Options >> select Add-ins.
- At the bottom of the window, in the Manage dropdown >> select COM Add-ins >> click Go.
- Check Microsoft Power Pivot for Excel >> click OK.
Step 2: Load Data into Power Pivot.
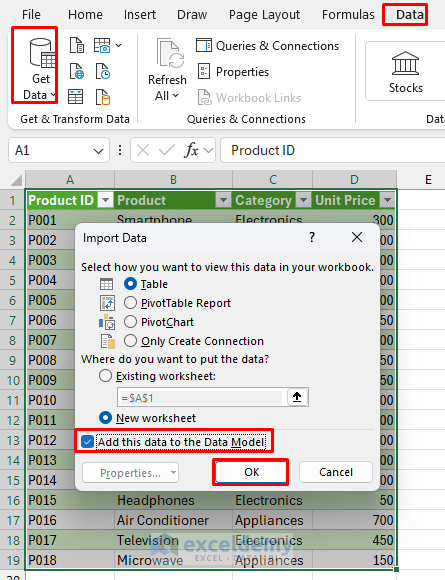
- Go to Data tab >> select Get Data to import data from different sources (e.g., multiple sheets, external databases, CSV files).
- Choose the data source (Excel Workbook, SQL Server, Text/CSV, etc.), then click Load To.
- From the Import Data dialog box:
- Select Table.
- Select New Worksheet.
- check the box for Add this data to the Data Model.
Note: Each table you load should have a unique identifier (like a Product ID or Customer ID) to enable relationships between tables.
Step 3: Create Relationships between Tables.
- Go to the Power Pivot tab >> select Manage to open Power Pivot Editor.

- Go to Diagram View to see all your tables visually.
- Drag and drop fields between tables to create relationships. Connect the Product ID from a Sales Table to the Product ID in a Product table).
- Go to the Home tab in Power Pivot >> select PivotTable.
- Choose where to place the Pivot Table (e.g., on a new worksheet) and click OK.

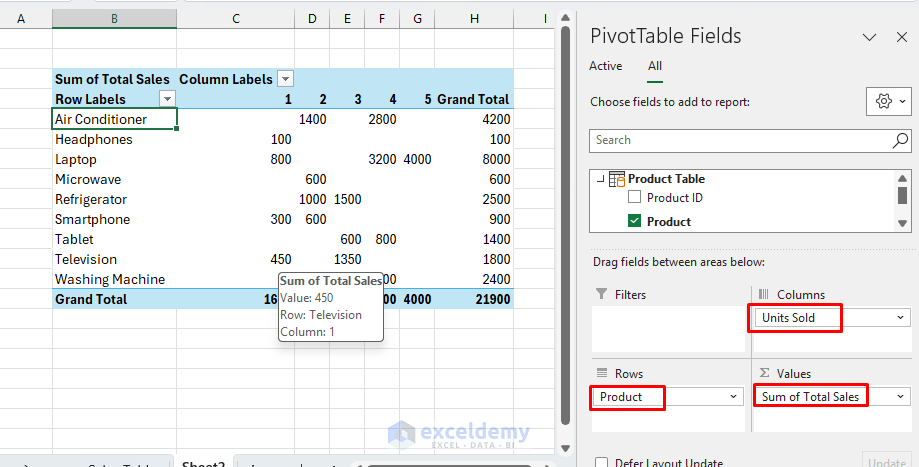
- In the Pivot Table Field List, you’ll see fields from all tables. Use these fields to create a report that pulls data from multiple sources.
- Drag Product from Product_Table to the Rows.
- Drag Unit Sold from Sales_Data to the Columns.
- Drag Total Sales from Sales_Data to the Values.
Conclusion
These advanced techniques let you customize the analysis and integration of multiple data sources, making your Pivot Tables even more insightful. Mastering calculated fields and consolidating multiple data sources in Excel’s Pivot Tables will help you to analyze complex datasets efficiently. With these techniques, you can get insights faster and manage data more efficiently.
Image by councilcle from Pixabay


