Adnan Masruf
Adnan Masruf, holding a BSc in Naval Architecture & Engineering from Bangladesh University of Engineering and Technology, plays a pivotal role as an Excel & VBA Content Developer at ExcelDemy. His deep passion for research and innovation seamlessly aligns with his dedication to Excel. In this capacity, Masruf not only skillfully addresses challenging issues but also exhibits enthusiasm and expertise in gracefully navigating intricate situations, underscoring his steadfast commitment to consistently delivering exceptional content. His interests are Advanced Excel, Data Analysis, Charts & Dashboards, Power Query, and Excel VBA.
Designation
Excel & VBA Content Developer at ExcelDemy in SOFTEKO.Lives in
Dhaka, Bangladesh.Education
B.Sc. in Naval Architecture & Marine Engineering, BUET.Expertise
C++, Python, Microsoft Suite, AutoCAD, Adobe Illustrator, ANSYSExperience
- Technical Content Writing
- Undergraduate Projects
- Design of a Stern Trawler for the Coastal Region of Bangladesh
- A Comparative Linear Buckling Analysis of Different Isotropic Plates with and without Stiffeners for Different Boundary Conditions.
Achievement
- “The Science Behind Swing and Reverse swing” at annual magazine of ASME Student Regional Board, Asia Pacific Region
Latest Posts From Adnan Masruf
Method 1 - Using the Paste Special Command Steps: Select the cell that contains the drop-down list in the Excel file. In this case, it will be B4. ...
Method 1 – Applying the TEXTJOIN Function to Convert Column to Text with Delimiter The TEXTJOIN function combines values from a range or ranges and separates ...
Download Practice Workbook You can download the practice workbook here. Change Color of One Line in Chart.xlsx Method 1 - Applying Righ-Click on ...
Step 1 - Calculating Total Quantities Sold Select the C11 cell and use the following formula: =SUM(C5:C10) Hit Enter. We ...
Method 1 - Calculating Basic Salary Select the B15 cell and write down the following formula, =VLOOKUP(B7,Structure!$B$5:$D$8,3,0)/D7*E7 Hit ...
Method 1 - Using the NORM.DIST Function Steps: Select cell F4 and enter the following formula: =AVERAGE(C5:C11) Press ...
We have the data of an owner with 5 shops rented by different renters. We will calculate the rents for October 2022 from the shops. Below is the ...
Method 1 - Creating a Graph Without Gaps Between Bars In this scenario, we want to display the Y-axis values to the left of the graph. To achieve this, follow ...
What Is a Three-Column Cash Book? A three-column cash book is a table with Debit and Credit on each side and each side has three columns. The first column ...
The balance sheet is a crucial accounting tool. This allows businesses to keep track of their assets and liabilities. But often a balance sheet is presented ...
What Is the Weighted Average? The weighted average is a neat way to calculate the average of the items that have different quantities as well as ...
Method 1 - Using a Combination of CELL, INDEX, and MATCH Functions Steps Select cell E5. Enter the following formula: ...
Method 1 - Applying Cell Formatting Steps: Choose the cell range containing text data. Here, C5:C10. Go to the Home tab and, select Number. Choose ...
India introduced the GST system to replace some of its messy indirect tax systems. This article will discuss the components of the GST system and provide a ...
Method 1 - Using TREND Function Steps: Select the D10 cell and write the following formula, =TREND(D5:D9,C5:C9,C10) Hit Enter. ...






Dear Nirmal,
Could you please provide me with your Excel file that you have mentioned or some screen shots from your dataset? That would help me to understand your dataset and answer your query accordingly.
Thanks for your query.
Regards,
Adnan
Team ExcelDemy
Dear Raman,
1. First, make sure you are using MS Office 365 as they are only available in that version.
2. Secondly, make sure you are logged into your MS Excel account.
3. Thirdly, make sure to have the English, French, German, Italian, Spanish, or Portuguese editing language added to Office Language Preferences.
If these do not work then,
-Go to File > Options > Trust Center > Trust center Settings > External Content > Security settings for “Linked data types” > Activate “Enable all Linked Data Types”
or
– Go to Options>Customize Ribbon> All Commands
– Then, choose the Datatype Command
-Add the command to a “New Group”
-Finally, restart your Excel Application.
*Also, make sure to keep your internet connection ON; as this data type is linked datatype.
*You should also see if this datatype is available in your geopolitical locaton.
Dear K,
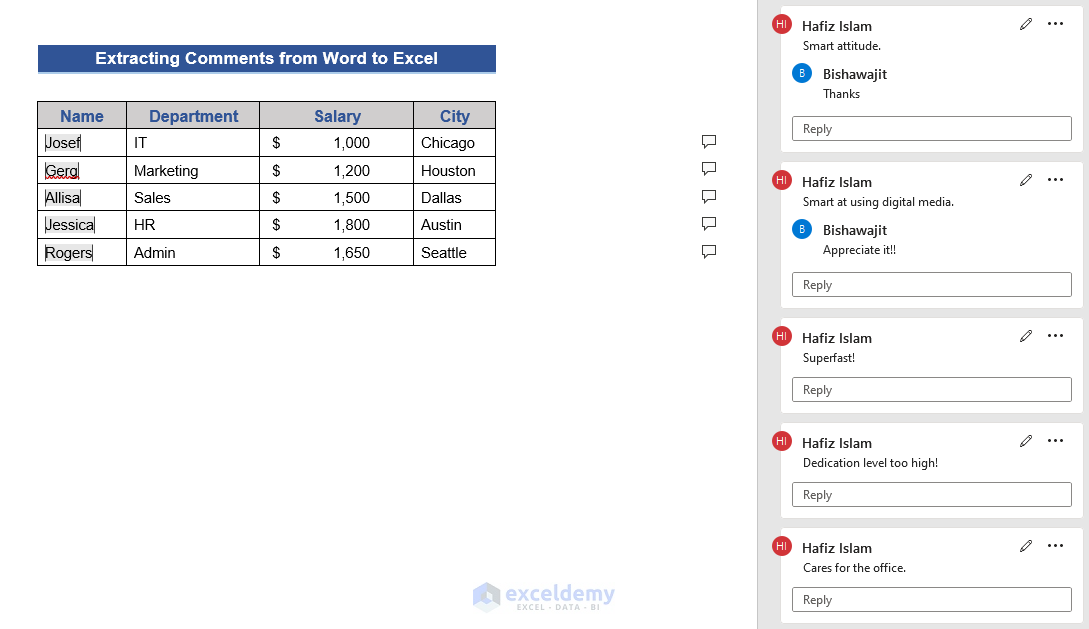
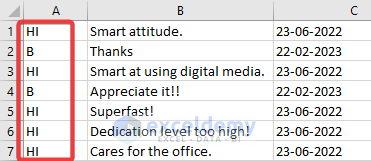
Thanks for your query. If we add replies to the comments (Like the first picture), we can find the replies by simply looking at the initials without changing the macros (Like the second picture)