Shakil Ahmed
My name’s Shakil. My articles are targeted to support you in enriching knowledge regarding different features related to Microsoft Excel. I am fond of literature, hope some knowledge from them will help me providing you some engaging articles even though some weary technical terms.
Latest Posts From Shakil Ahmed
Method 1 - Using Highlight Cells Rules Feature Steps: Select all the cells from B5 to C10. Go to the Home tab and click on Conditional ...
Below is a basic table listing the sites and their respective monthly visits. The second column has a couple of duplicate values. Method 1 - ...
Below is the practice workbook, which is the base of our examples. Basics of MIN - MAX 1. MIN Function The MIN function returns the least numeric ...
For illustration, we have a Customer-wise Sales report of a company. Using this table, we will find the Total Purchase of any Customer across several ...
Method 1 - Using LARGE Function The LARGE function can return the largest number from a list of numbers after we sorted it in descending order. Let us see how ...
This is the sample datset. Method 1 - Using the MIN Function to Find the Minimum Value in Excel The syntax for the MIN function is ...
Example 1 - Inserting Dates Directly into COUNTIFS Function to Count Between Two Dates Steps: Select cell F5. Enter the following COUNTIFS function ...
We have a sample table of Products and revenue of the items for each month from January to June. The revenues for each month are stored in separate columns. ...
Below is a sales report dataset containing 4 columns: City, Seller Name, Product, and Quantity. We want to sum the quantity of the products according to ...
This is the sample dataset: Method 1 - Using the SUMIF Function with a Single Criterion Steps: Select I6 and enter the formula below. ...
Here's the dataset we'll use to count rows. We have a table with three columns; Books, Genre, and Author. There are 10 books listed. To show the count ...
Download Practice Workbook Count Cells with Text.xlsm Method 1 - Using COUNTA Function Steps: Go to cell C10 and insert the following ...
We have the Sales Rep, City, and Salary columns. There are a few values that are repeated within the columns. We’ll count the number of occurrences of each ...
Consider a sample dataset where you want to calculate the grade or score average for students. Method 1 - Using Number Formatting in Excel to Round ...
The dataset showcases students' Name, ID, Course and City. The examples below will be stored in separate sheets. Method 1 - Applying ...


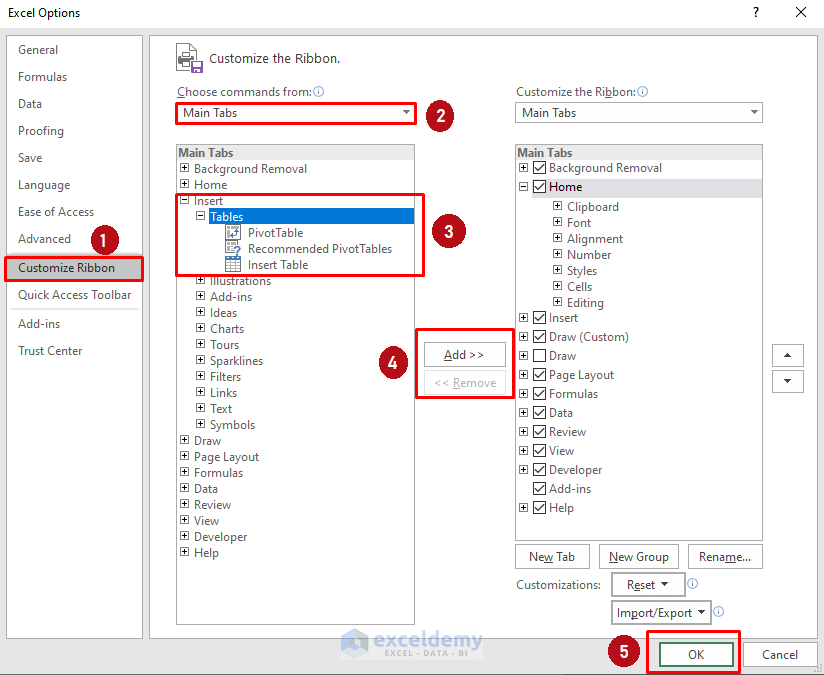
Bob, PivotTable is one of the prime features of Excel, so regardless of the version (contemporary versions) you should get it inside the “Insert” tab of the ribbon. But if you don’t find that there you may need to customize your ribbon. Click on File > Options, then follow the image
And if counting unique is your main goal right now you might get that using the UNIQUE function (and COUNT family function for counting).
Thanks for commenting Merle, glad to hear that it helped you.