Sudipta Chandra Sarker
Sudipta Chandra Sarker, BSc, Electrical and Electronic Engineering, Bangladesh University of Engineering and Technology, Bangladesh, has worked on the ExcelDemy project for over a year. For ExcelDemy, he has authored 42 articles and reviewed over ten articles. He is employed as a junior software developer at the moment. He aims to create various useful Microsoft Office Add-ins, extending the functionality of Office programs. His interests span Microsoft Office Suites, Data Science, VBA, VB.NET, ASP.NET, C#, Excel, and Desktop application development.
Designation
Junior Software DeveloperEducation
B.sc in Electrical and Electronic Engineering, BUETExpertise
VB.NET, C#, C, Matlab, Verilog, Assembly Programming, Microsoft Excel, Microsoft Office, Machine Learning (Basic)Experience
- Technical Content Writing
- Software Developing
- Team Work
Undergraduate Projects and Thesis
- SymSwarm: A Two-staged Decentralized Symmetrical Pattern Formation paradigm for a Swarm in Mobile Robots
- Identify sources and estimate the amount of carbon emission in local areas to aid scientists in mapping carbon sources and sinks. (NASA Space APP Challenge 2020)
Research & Publication
- Spectral Efficiency of Multiuser Massive MIMO-OFDM THz Wireless Systems with Hybrid Beamforming under Inter-carrier Interference. In 2022 12th International Conference on Electrical and Computer Engineering (ICECE) (21-23 Dec. 2022)
- SymSwarm: A Two-Staged Decentralized Symmetrical Pattern Formation Paradigm for a Swarm of Mobile Robots. Published in Arabian Journal for Science and Engineering (17 August 2023)
Summary
- Currently working as Junior Software Developer in Software Development Team.
- Started technical content writing of Excel & VBA on 1 November 2022.
Latest Posts From Sudipta Chandra Sarker
Here's an overview of shadow price calculations. Calculate Shadow Price Linear Programming in Excel: Step-by-Step Procedures The sample dataset ...
In this article, we will demonstrate how to use the LARGE function with criteria in Excel. Using the following dataset containing the marks in ...
What Is a Histogram in Excel? A histogram shows the frequency of data in different intervals within the data range. It is a graph with a series of rectangular ...
Method 1 - Use IF Statement Between Two Numbers in Excel 1.1. Use IF Statement Between Two Numbers Exclusively Declare the boundary numbers. We have ...
Method 1 - Perform Interpolation of Linear 2D Data in Excel 1.1 Apply Mathematical Equation for Linear Interpolation There is an established mathematical ...
In this article, we will demonstrate how to create a Progress Doughnut Chart to show the percentage of progression of a task in Excel. To demonstrate the ...
Step 1 - Prepare the Dataset The dataset needs to contain the task schedule of a project. Column B contains the various tasks. Column C ...
STEP 1 - Prepare the Dataset In this dataset, there is information about the population of humans and African Elephants over a large range of time. We ...
Method 1 - Make the Dataset Ready Collect the information about the mobiles stored in the shop. Collect the images of the mobiles that are available. ...
The dataset showcases the sales quantity of electronic products on different dates in January, February and March 2022. Method 1- Use the Sort & ...
What Is Delta Hedging? In stock markets, delta hedging is used to lower the risk and maximize profit. Example 1- Calculate Delta Hedging Using Stocks in ...
To create a monthly duty roster in Excel, first we'll create a roster template, then fill the roster for a specific month into this remplate as an example. ...
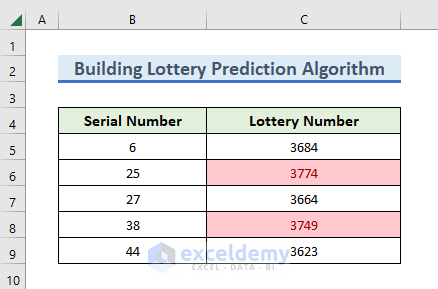
The sample dataset contains 2 columns. The 1st one with a series of lottery numbers and a 2nd column, in which the probability of selecting a serial number ...
STEP 1 - Create a List of Stages of the Deal A list of 4 stages is created. Lead indicates that the deal is in the primary stage. ...
Method 1 - Insert Format of Fibonacci Calculator Insert a format of the calculator. We have our format for the Up Trend. Method 2 - Add ...


