We will be using two datasets for illustration.
Method 1 – Calculate Margin of Error with Standard Deviation
Steps:
- Select a cell for average.
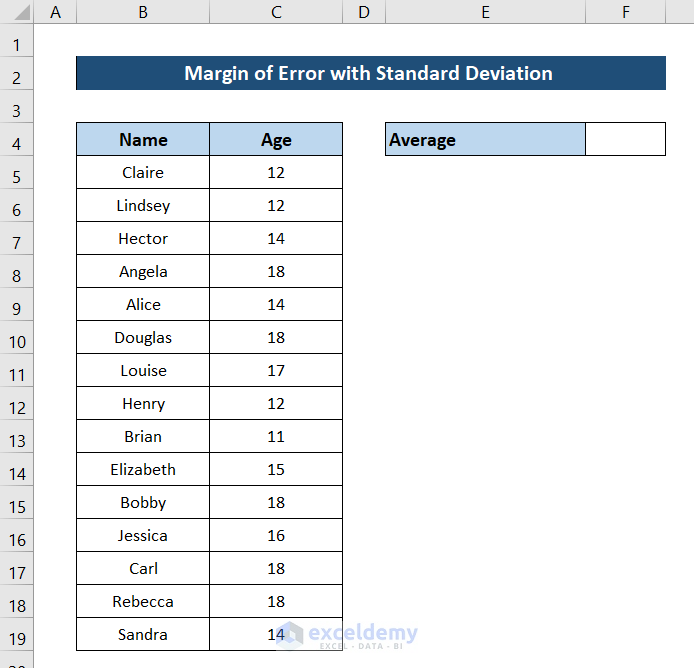
- Select the cell and add down the following formula in it.
=AVERAGE(C5:C19)

- Press Enter. You will have the average for the ages.
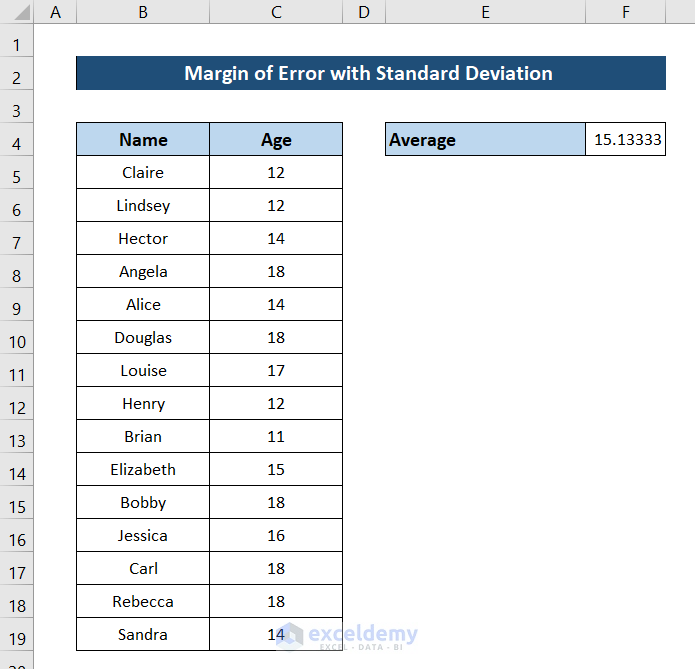
- Select a cell for the standard deviation and add the following formula in it. We are using cell F5 for this.
=STDEV.S(C5:C19)
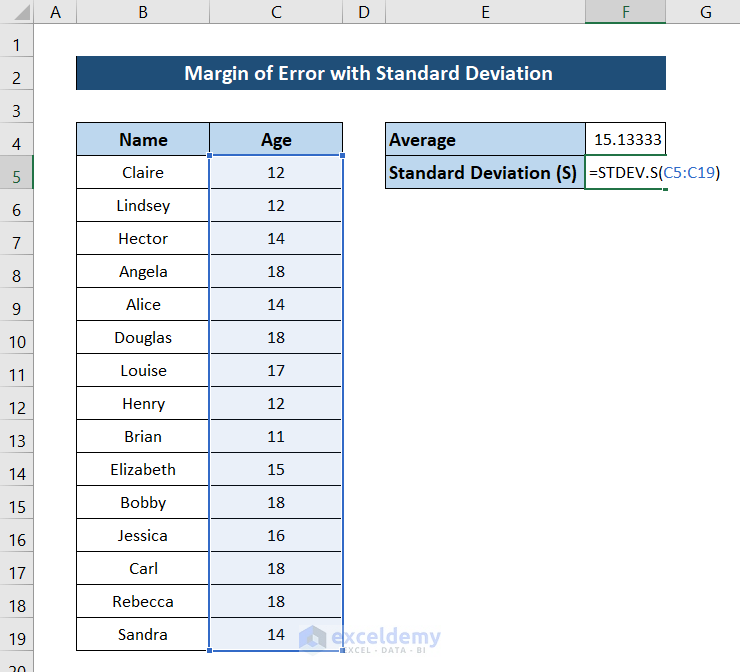
- Press Enter. You will have the standard deviation of the ages.
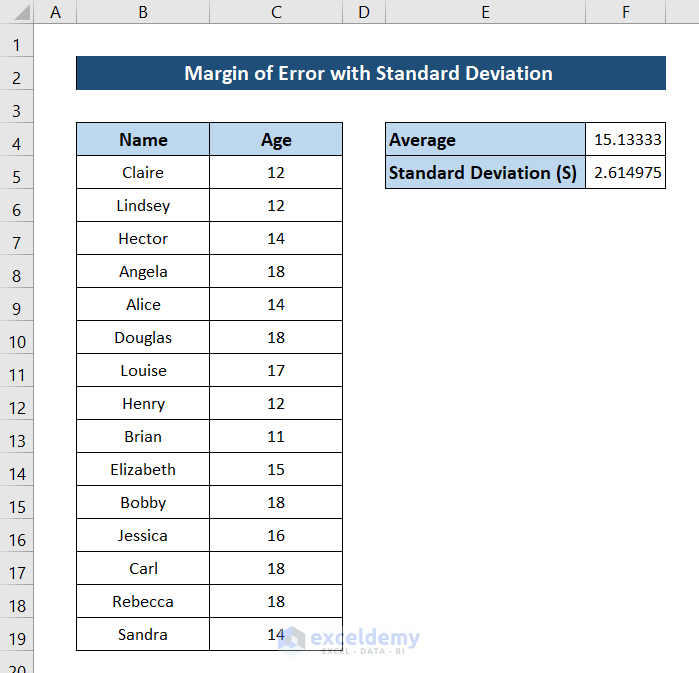
- Select a cell for the Z score and add the following formula for the z score at an alpha value of 5.
=NORM.S.INV(0.975)
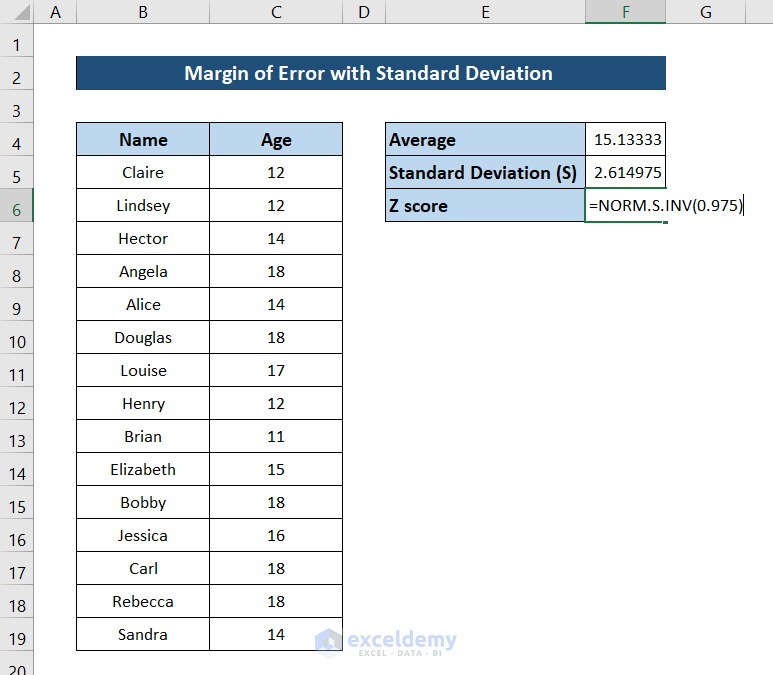
- Press Enter to get the Z score for the desired confidence.
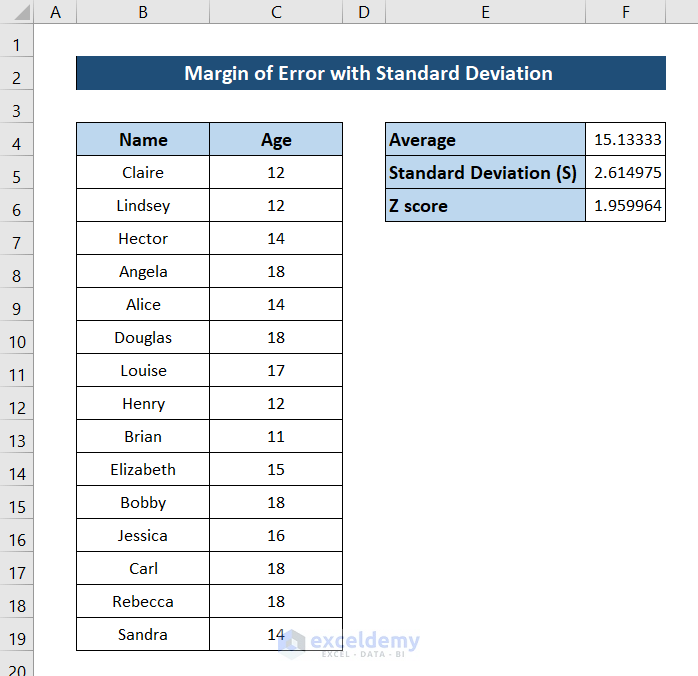
- Select a cell for the sample size and add the following formula in it.
=COUNT(C5:C19)
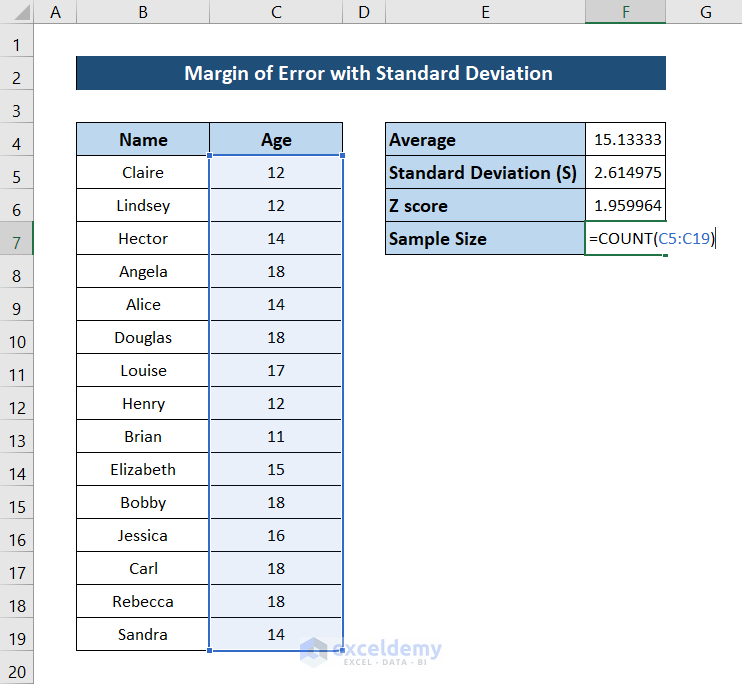
- Press Enter to get the sample size of the dataset.
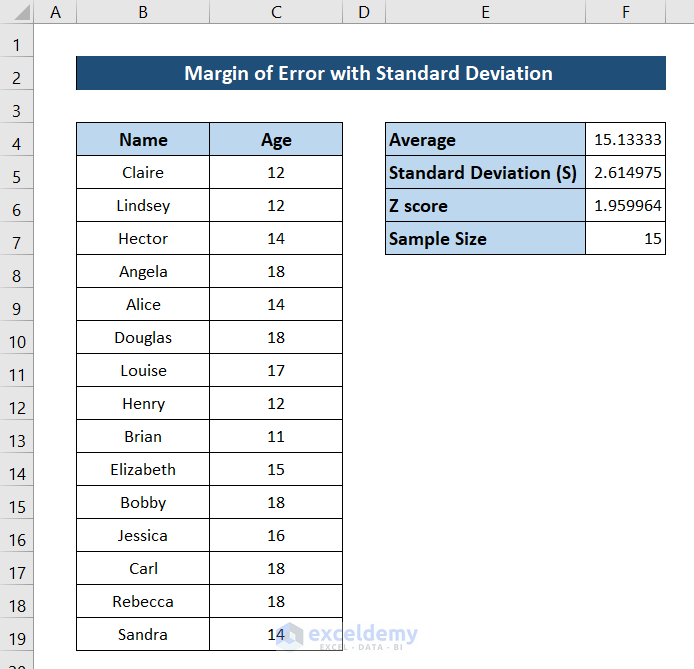
- Select a cell for the margin of error and add the following formula.
=F6*F5/SQRT(F7)
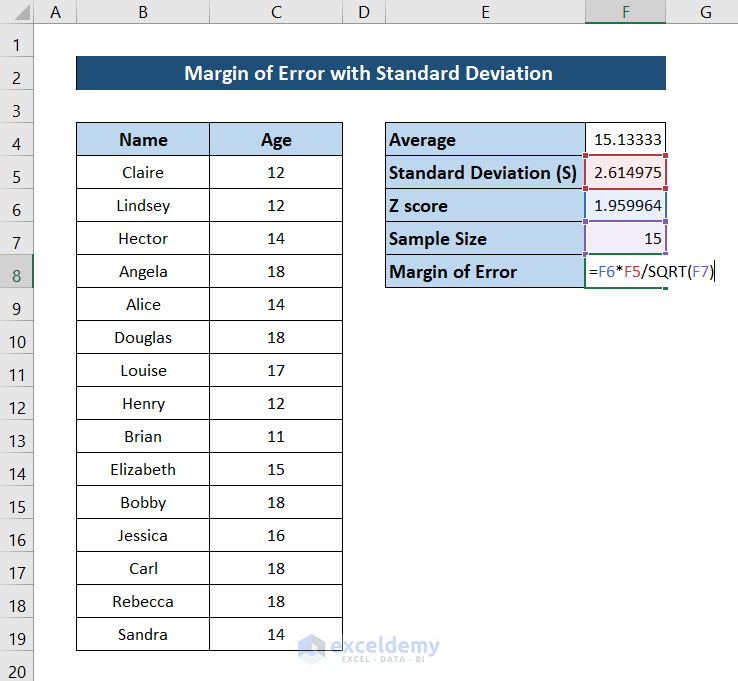
- Press Enter to get the margin of error.
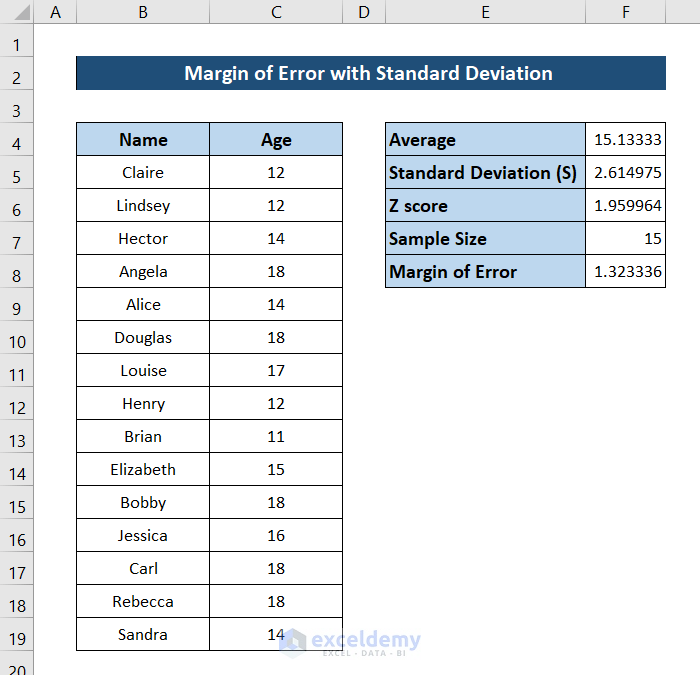
Read More: How to Resample Time Series in Excel
Method 2 – Using Sample Proportion to Calculate Margin of Error
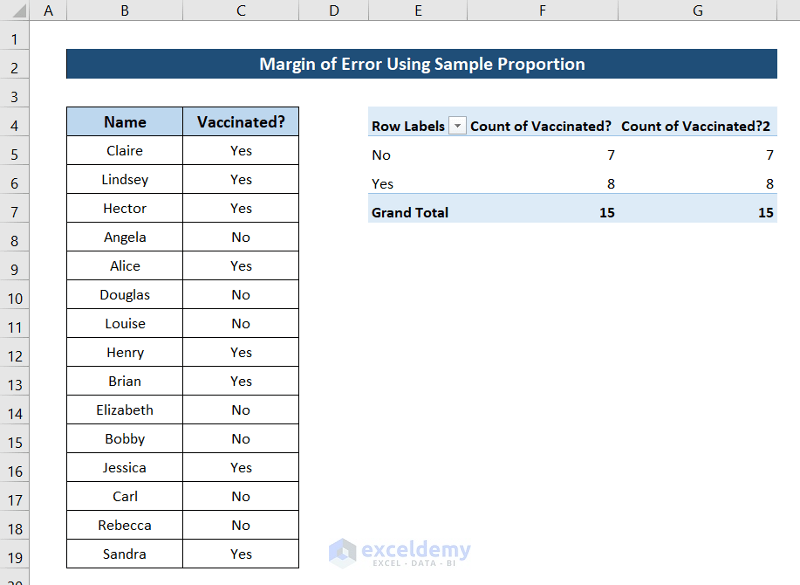
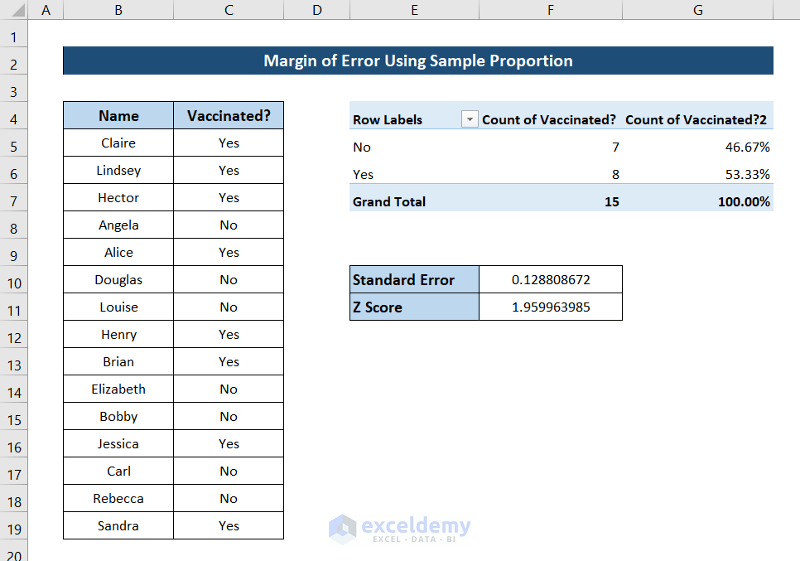
The dataset is divided into sample proportions of whether the children are vaccinated or not. We are going to calculate the margin of error in finding if a child is vaccinated or not.
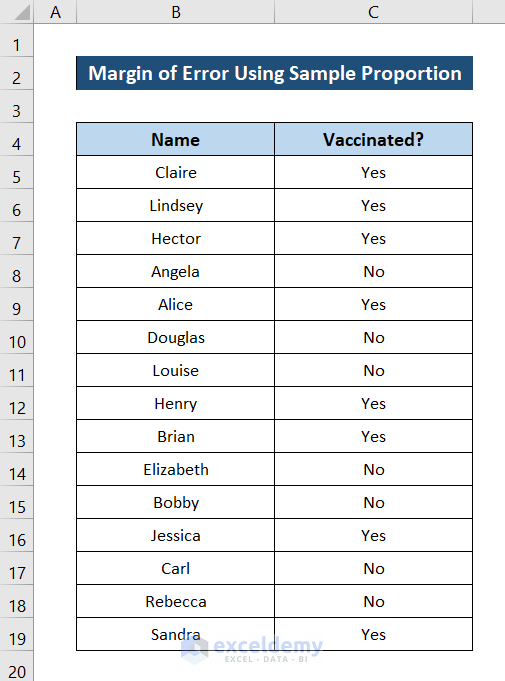
Steps:
- Select the column with the data in question.
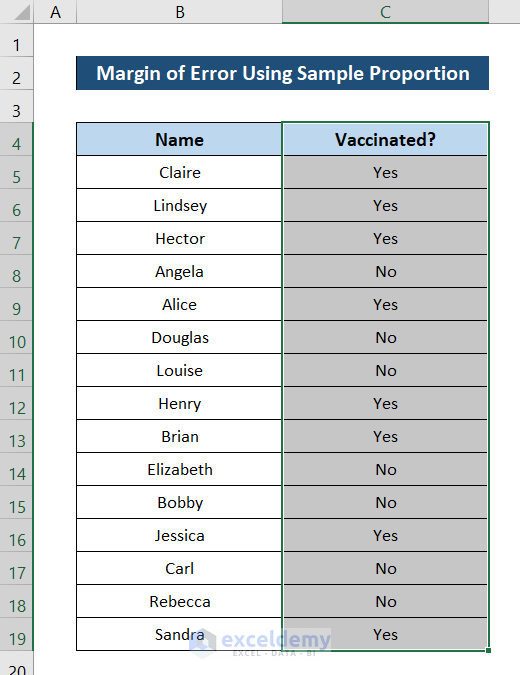
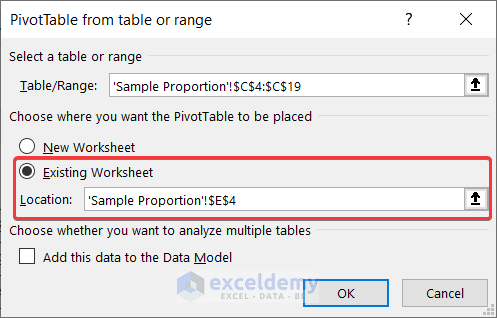
- Go to the Insert tab on the ribbon and select PivotTable from the Tables group.

- The pivot table box will open. Select the place where you want your pivot table to go. We are selecting the existing workout for this example.
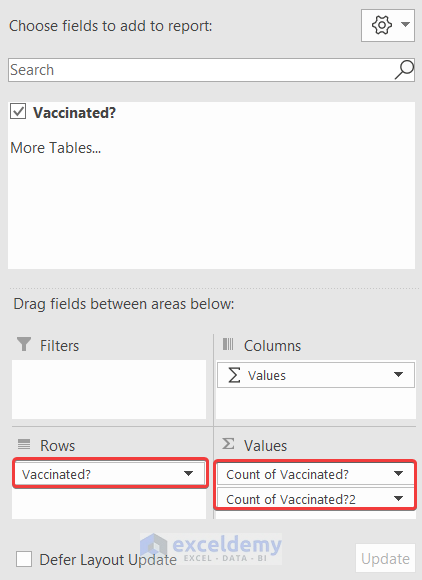
- Drag Vaccinated to Rows field and the same twice to the Values.
- A pivot table will open.
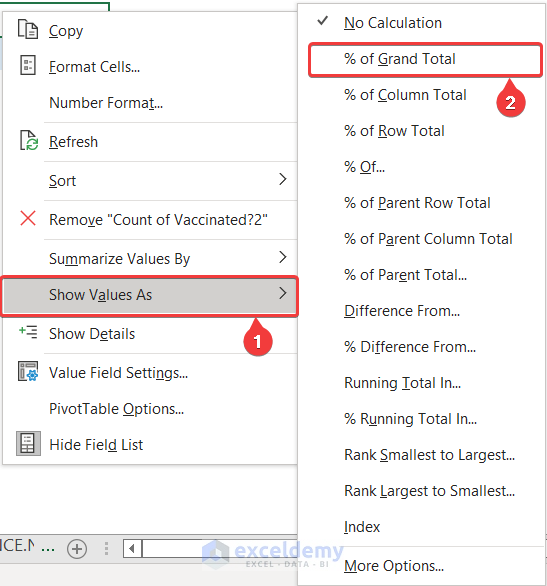
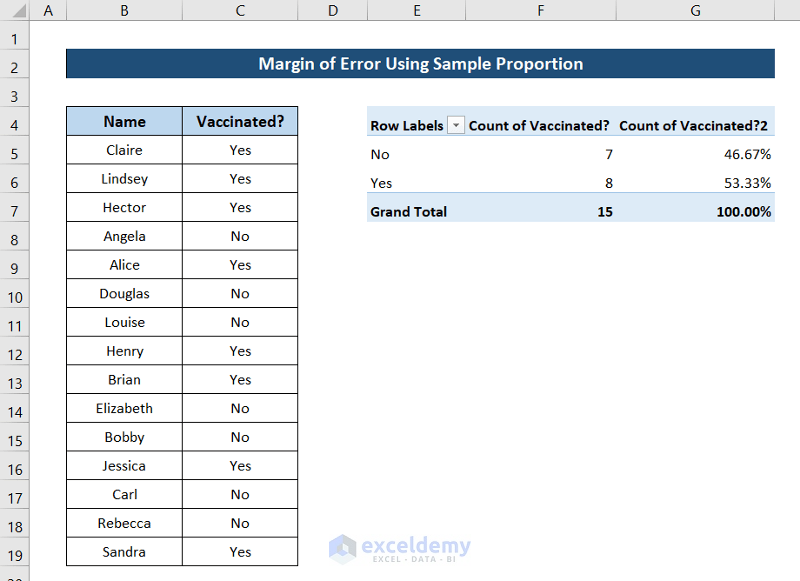
- Right-click on the third column of the pivot table and select Show Value As and then % of Grand Total from the context menu.
- The pivot table will look like this.
- Select a cell for standard error and add the following formula for this dataset.
=SQRT(0.5333*(1-0.53333)/15)
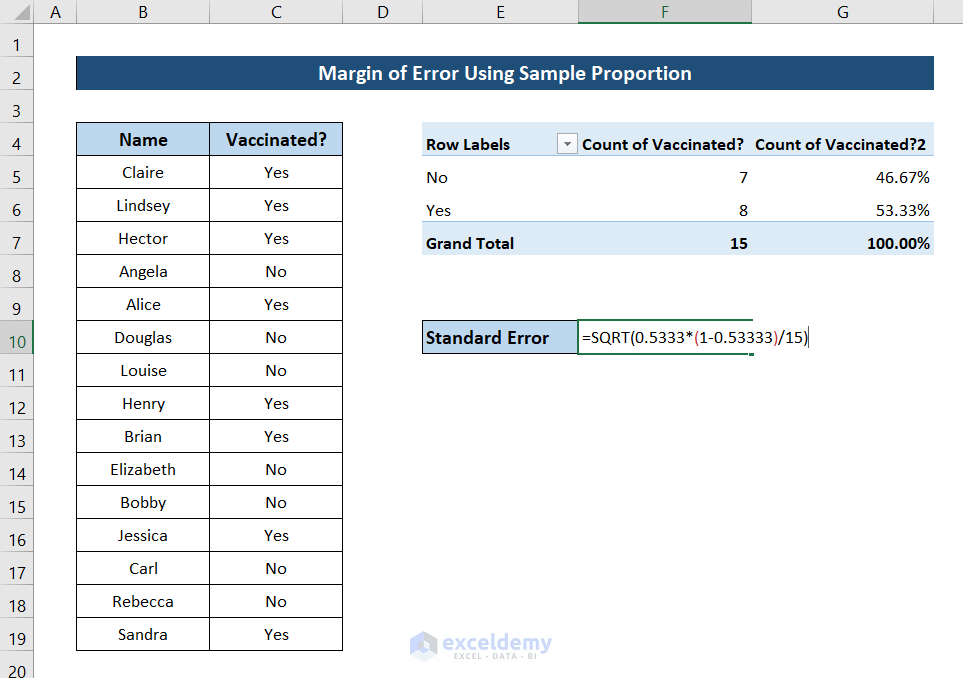
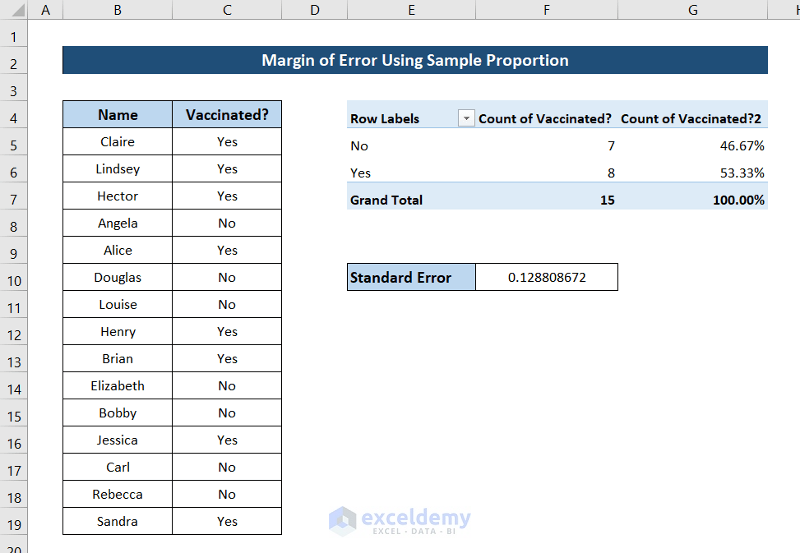
Replace 0.5333 with your success values and 15 with your total count values if you have a different dataset.
- Press Enter.
- Select a cell for calculating the Z score and add the formula for an alpha value of 5.
=NORM.S.INV(0.975)
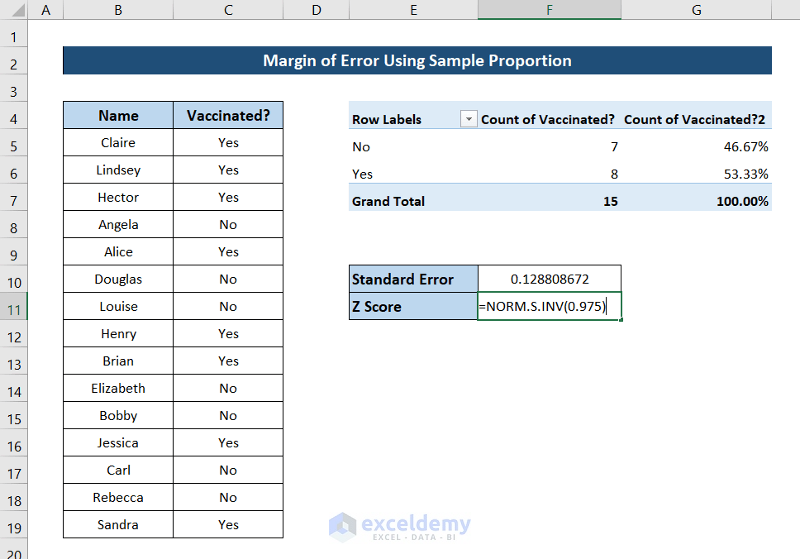
- Press Enter.
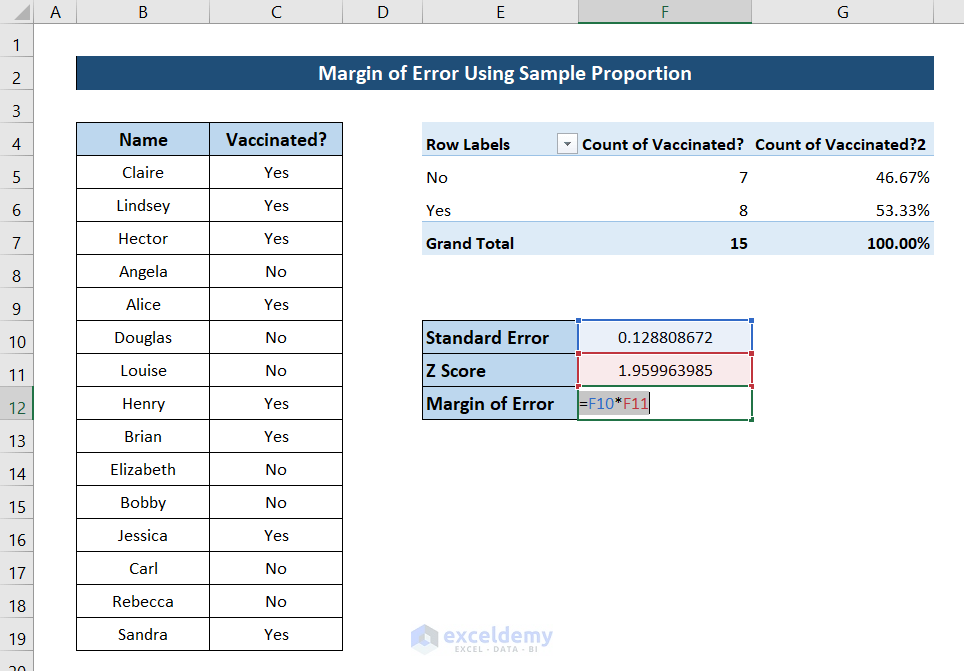
- Select a cell for the margin of error and add the following formula.
=F10*F11
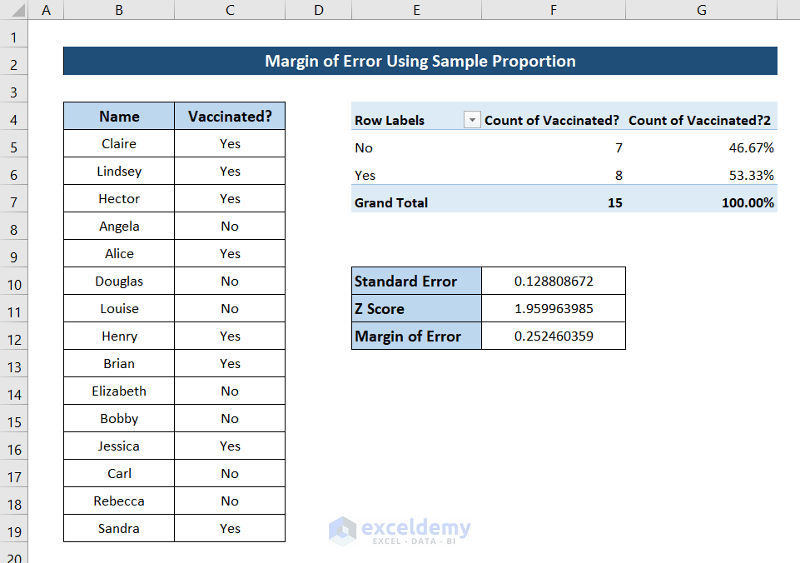
- Press Enter and you will have the margin of error calculated in Excel for a dataset with sample proportion.
Read More: How to Find Mean, Median, and Mode on Excel
Method 3 – Estimate Margin of Error Using CONFIDENCE.NORM Function
This function takes the alpha value, standard deviation, and the sample size as arguments and returns the margin of error of the dataset directly. So we need to first calculate the sample size and standard deviation of the sample. We can do that by using the STDEV.S and COUNT functions.
For demonstration, we are going to use the same dataset as above.
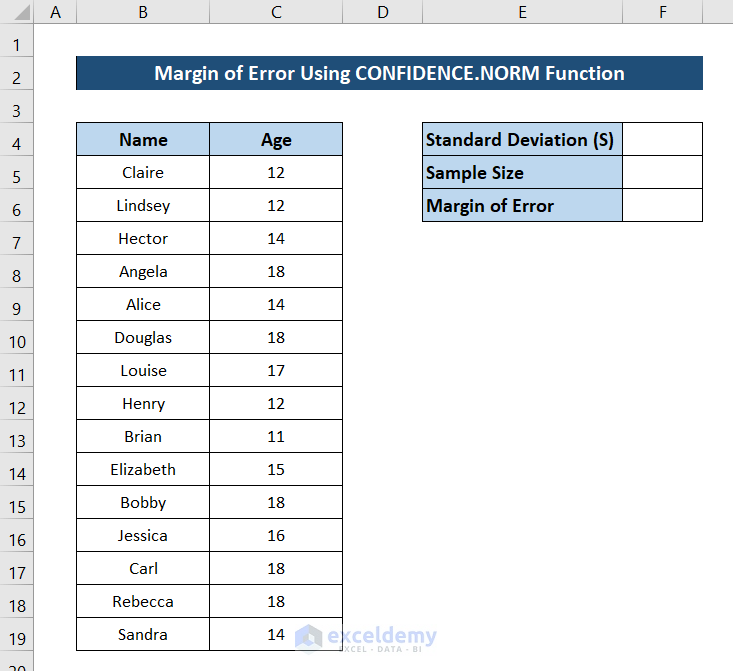
Steps:
- Select cell F4 and add the following formula.
=STDEV.S(C5:C19)
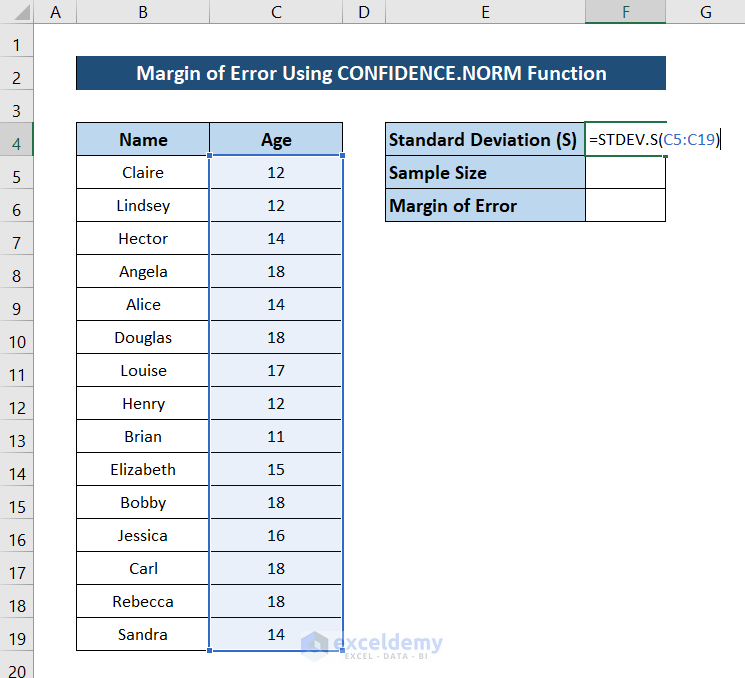
- Press Enter and you will have the standard deviation of the dataset.
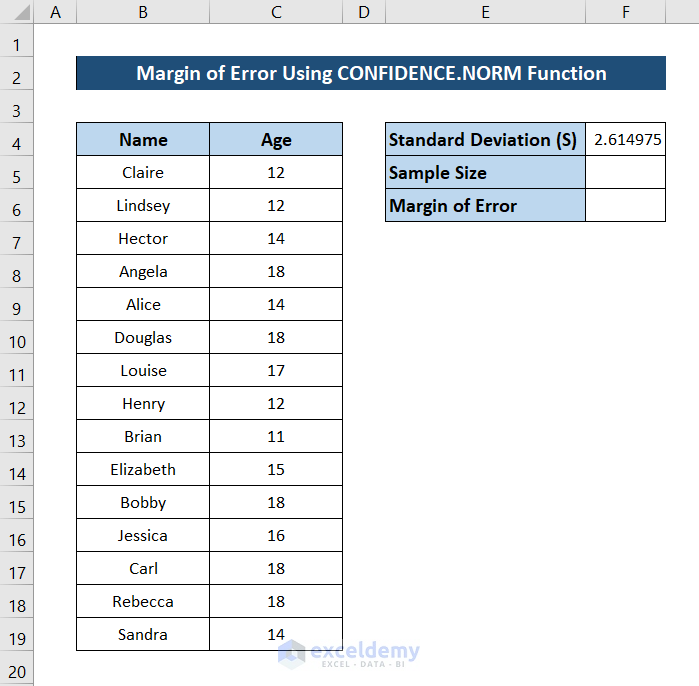
- Select cell F5 and add the following formula in it.
=COUNT(C5:C19)
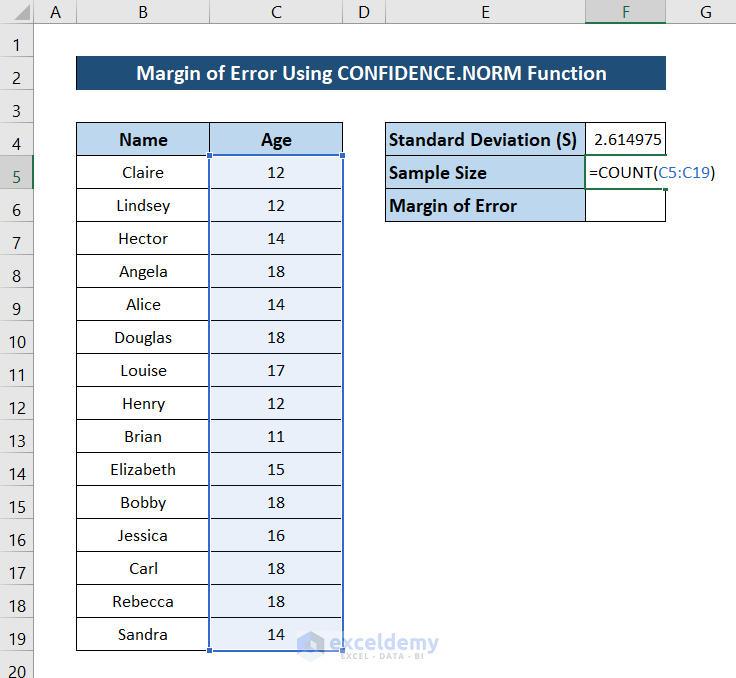
- Press Enter.
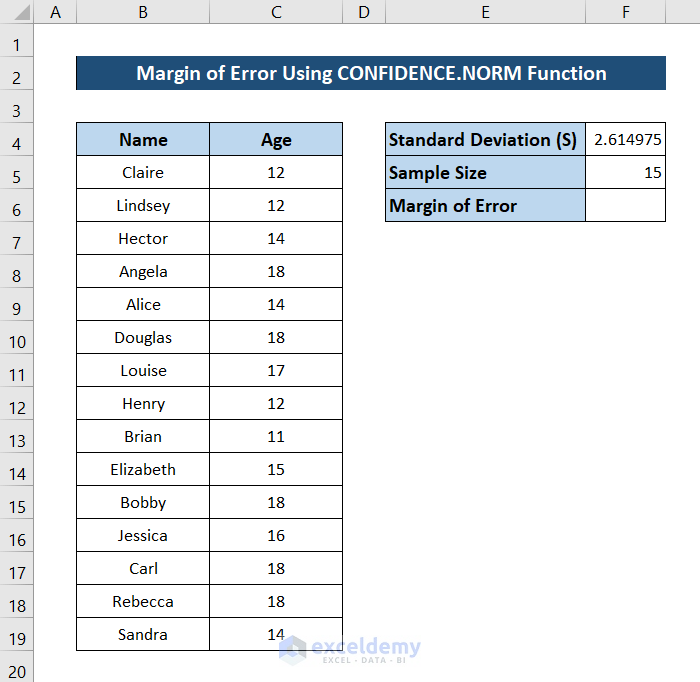
- Select cell F6 and add the following formula.
=CONFIDENCE.NORM(0.05,F4,F5)
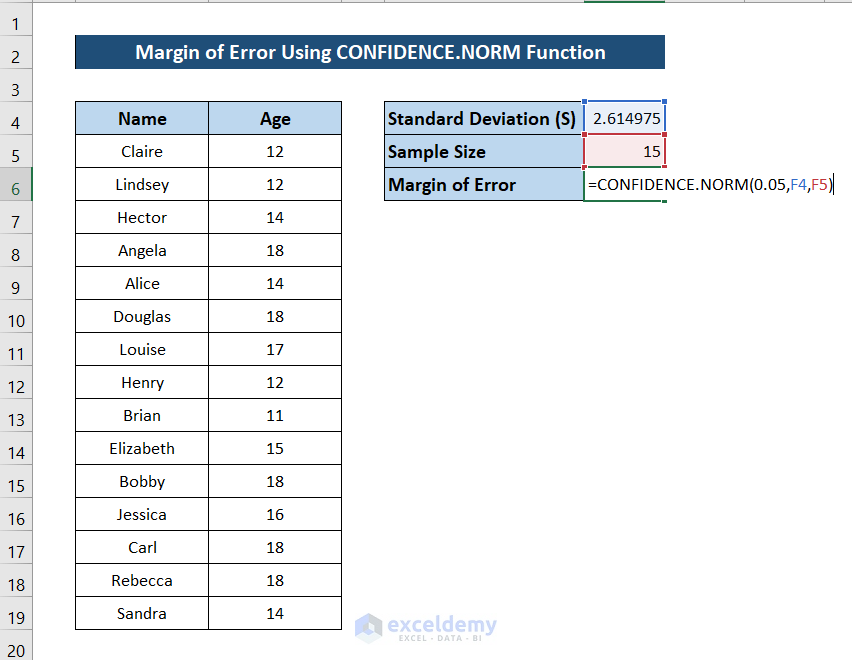
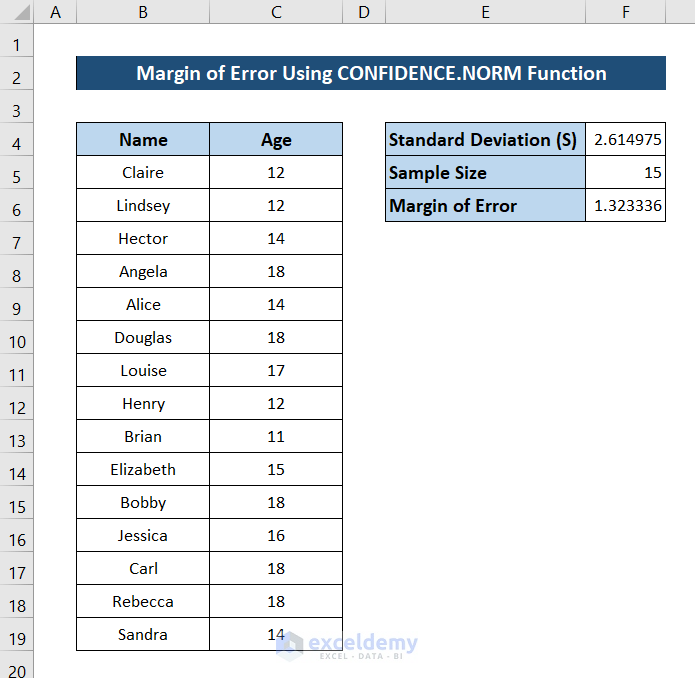
- Press Enter and you will have the margin or error of the dataset.
Read More: Comparison Among MAX vs MAXA vs LARGE and MIN vs MINA vs SMALL Functions in Excel
Method 4 – Calculate Margin of Error Utilizing Data Analysis Tool
Steps:
- Select the column that has the data for finding the margin of error.

- Go to the Data tab and select Data Analysis from Analysis.

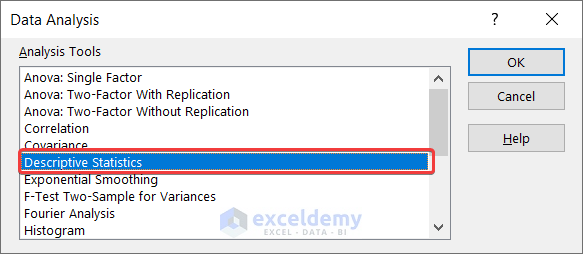
- Select Descriptive Statistics in the Data Analysis box and click on OK.
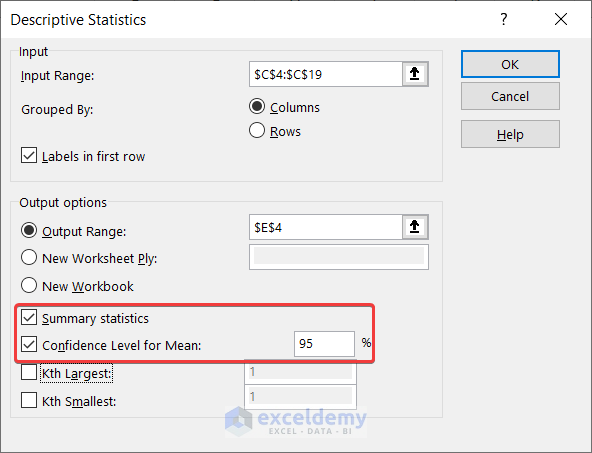
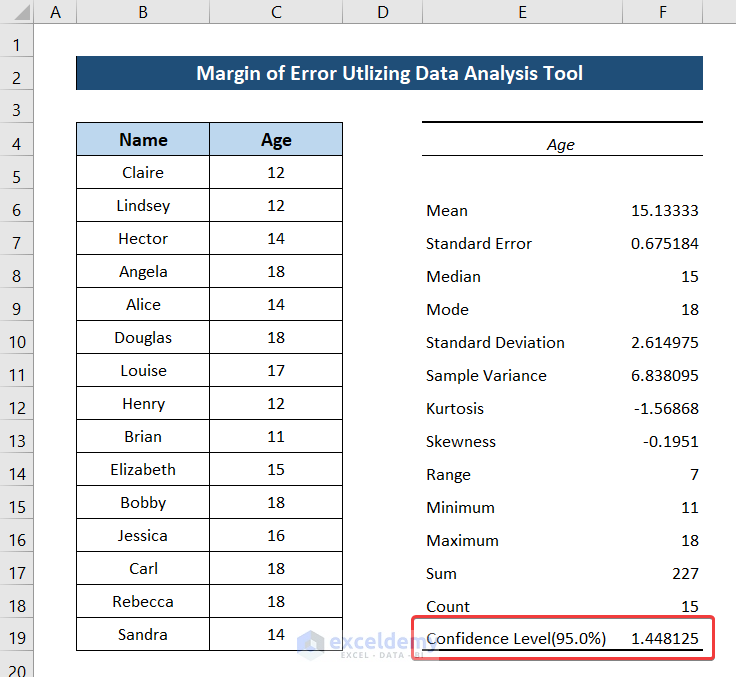
- Select the options depending on your selection and the place where you want the statistics to appear. But be sure to check the Summary statistics and Confidence Level for Mean box.
- After clicking on OK the statistics will appear like this. You can find the margin of error as the confidence value as shown in the figure.
Method 5 – Applying CONFIDENCE.T Function
Steps:
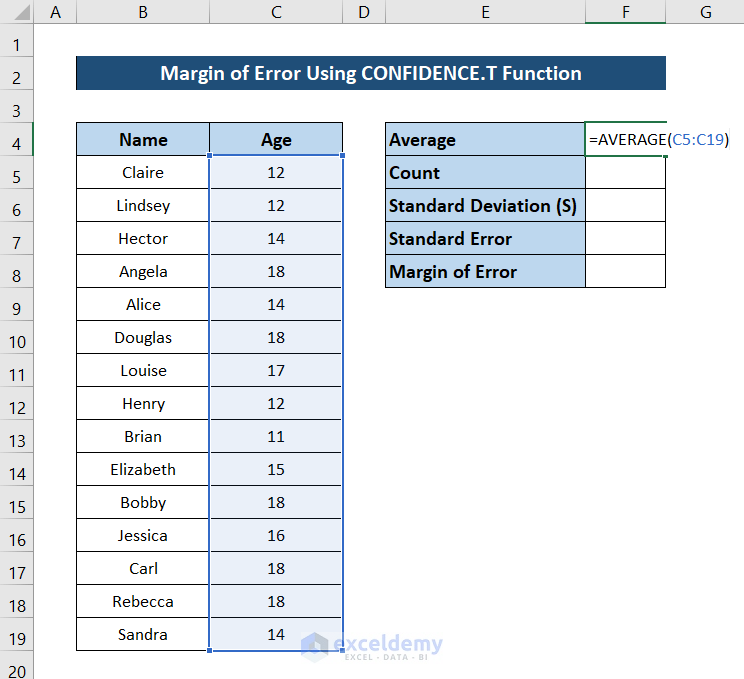
- Select cell F4 and add the following function.
=AVERAGE(C5:C19)
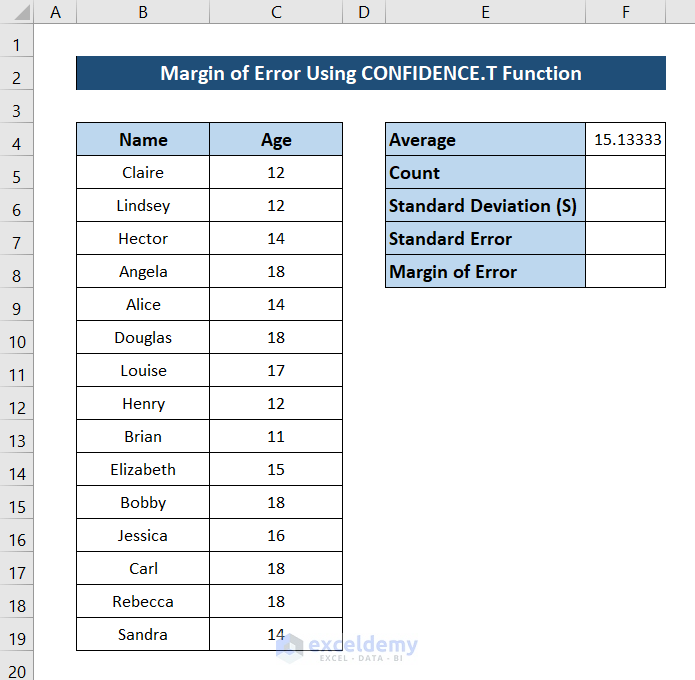
- Press Enter and you will have the average of the data.
- Select cell F5 and add the followding formula.
=COUNT(C5:C19)
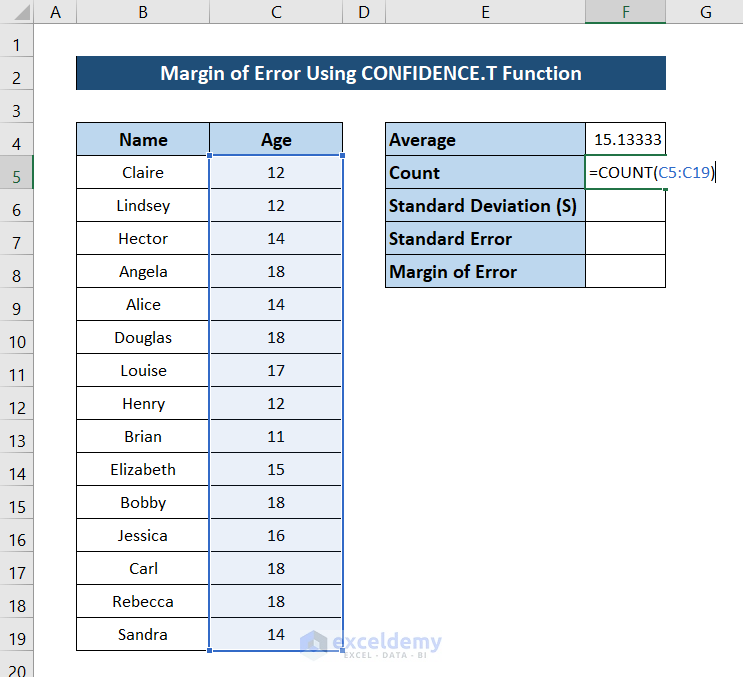
- Pressing Enter you will have the sample size of the data.
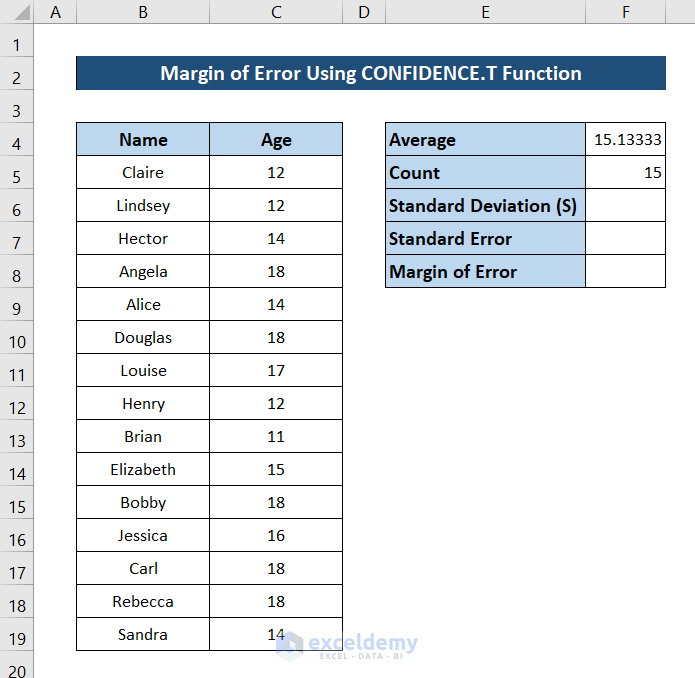
- Select cell F6 and add the following formula.
=STDEV.S(C5:C19)
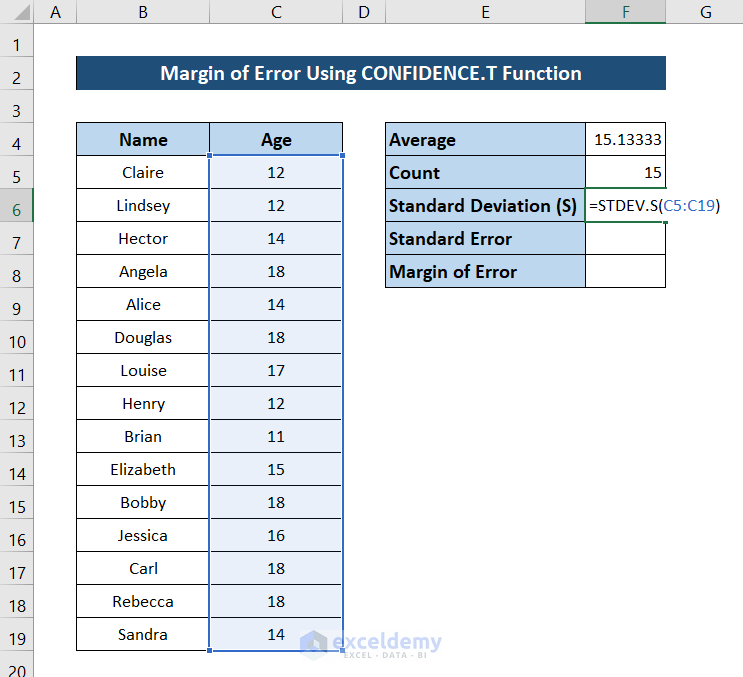
- Press Enter. You will have the standard deviation of the dataset.
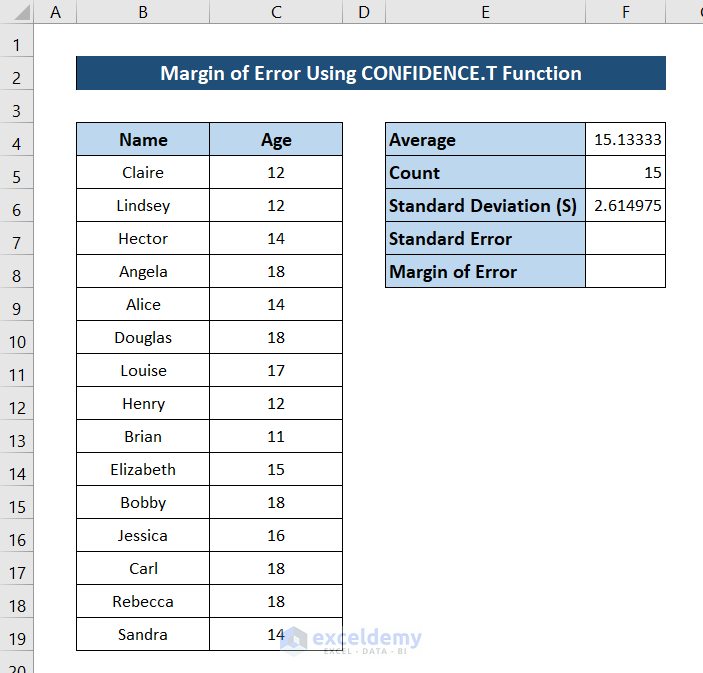
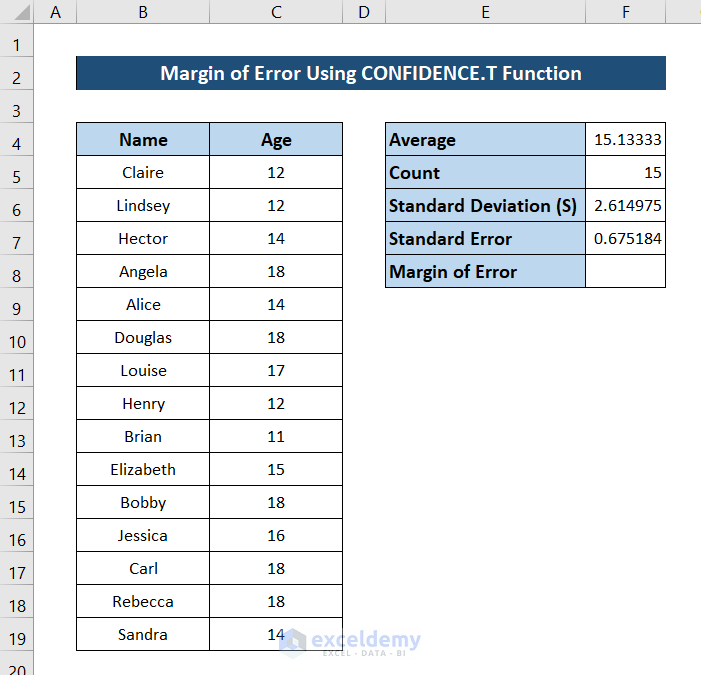
- Select cell F7 and add the following formula.
=F6/SQRT(F5)
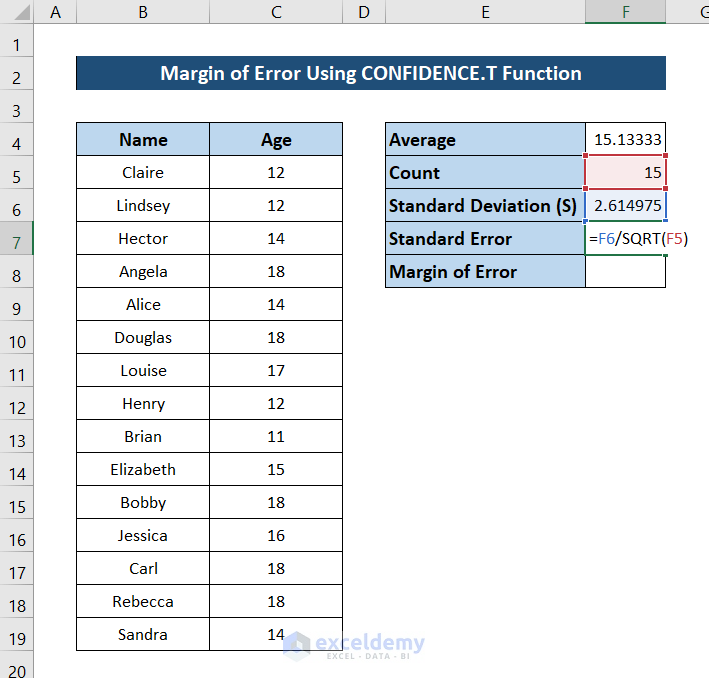
- Pressing Enter will give you the standard error of the data.
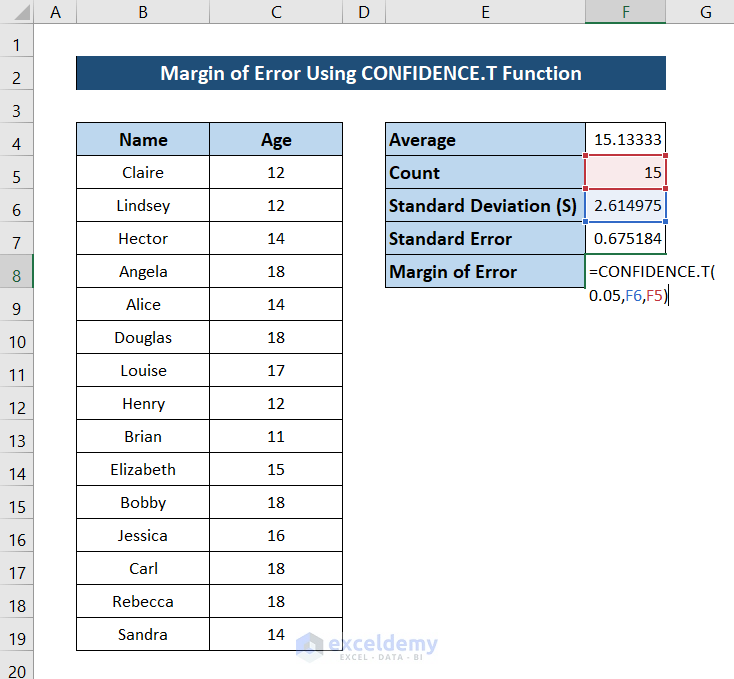
- Select cell F8 and add the following formula.
=CONFIDENCE.T(0.05,F6,F5)
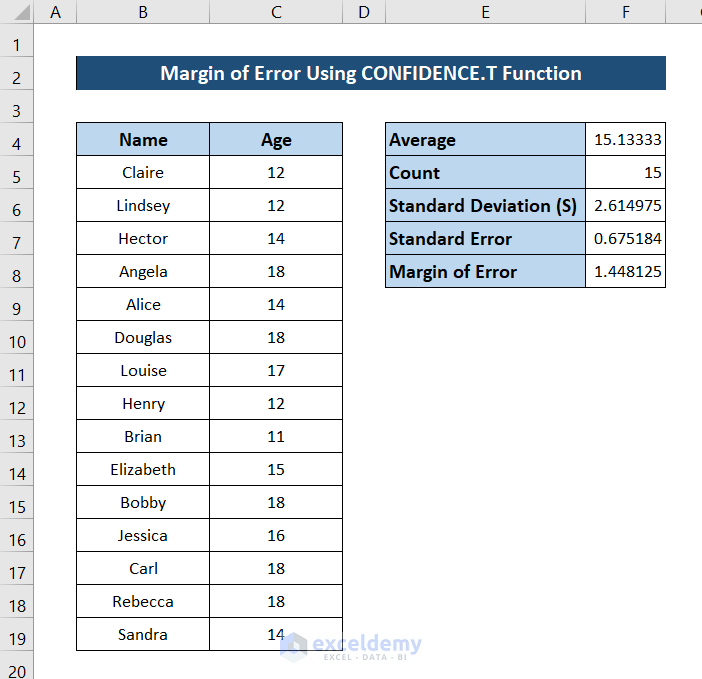
- Press Enter and you will find the margin of error of the dataset.
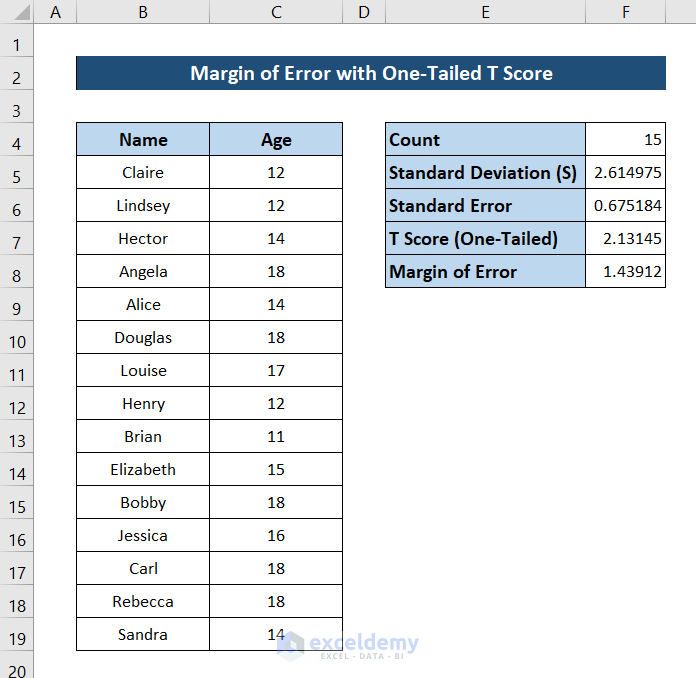
Method 6 – Evaluate Margin of Error with One-Tailed T Score
Steps:
- Select cell F4 and add the following formula.
=COUNT(C5:C19)
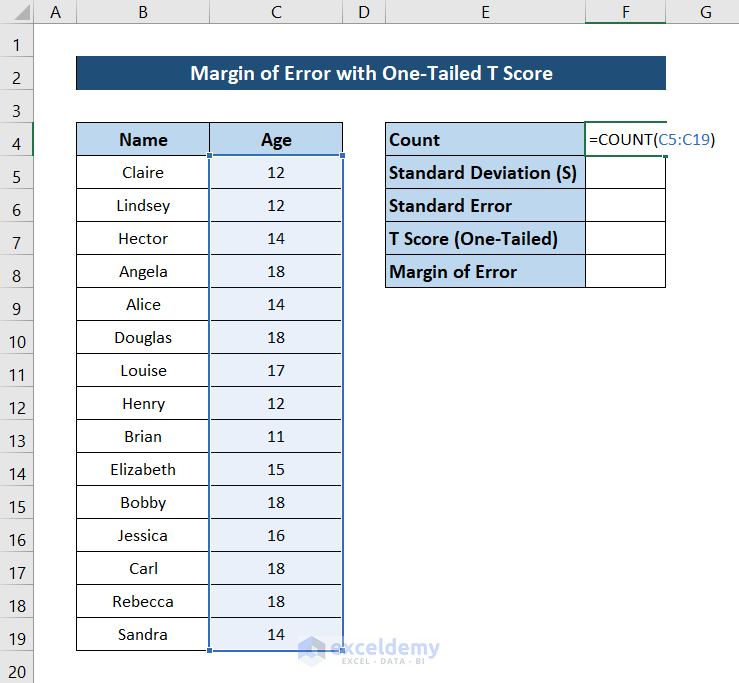
- Press Enter.
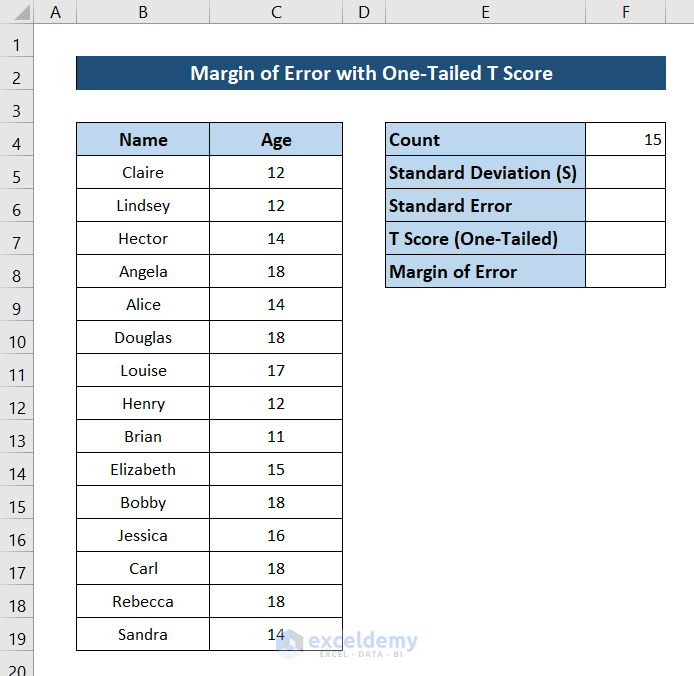
- Select cell F5 and add the following formula.
=STDEV.S(C5:C19)
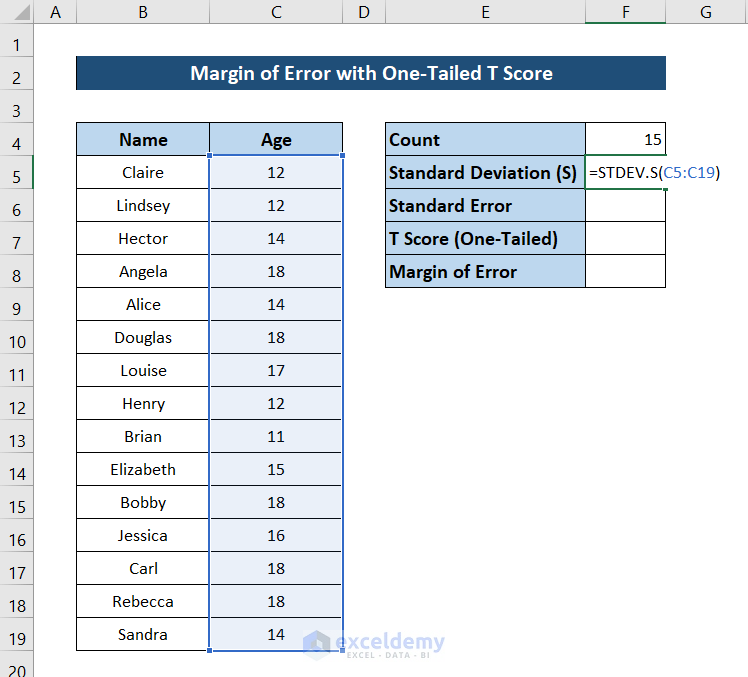
- Press Enter and you will have the standard deviation.
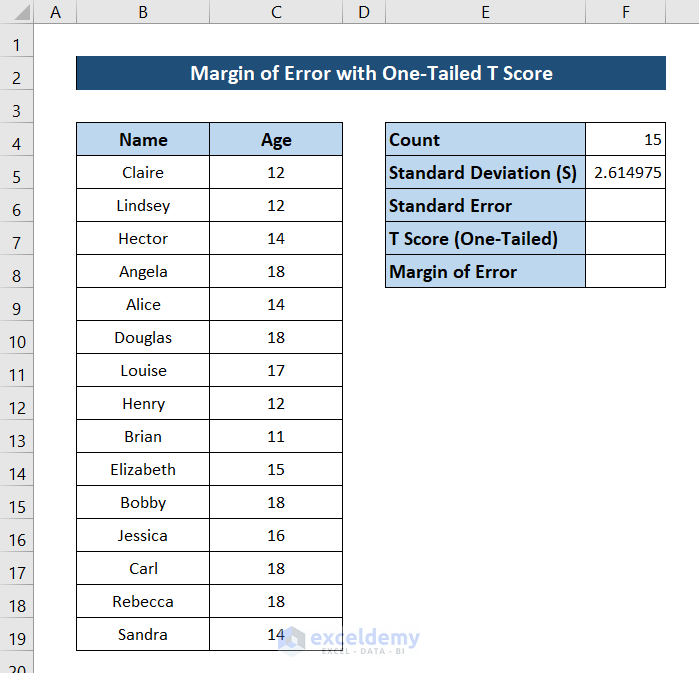
- Select cell F6 and add the following formula.
=F5/SQRT(F4)
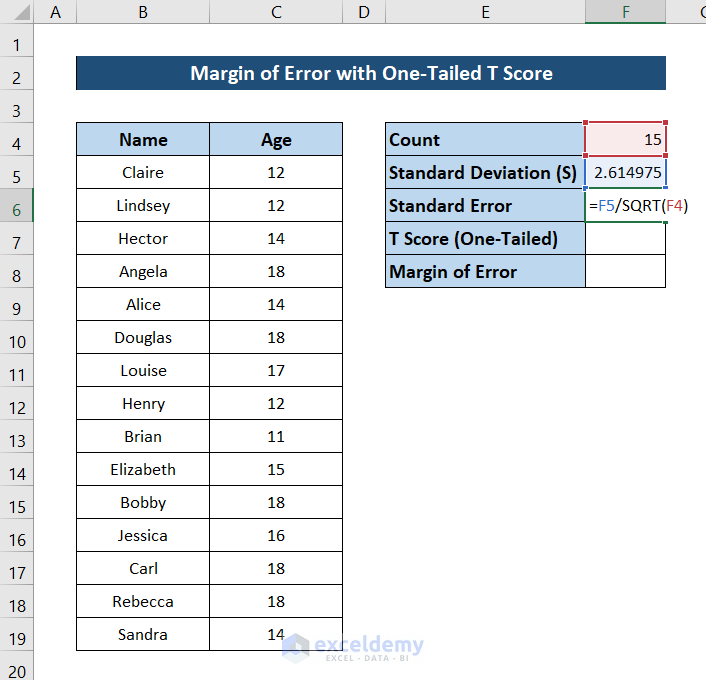
- Pressing Enter will give you the standard error of the data.
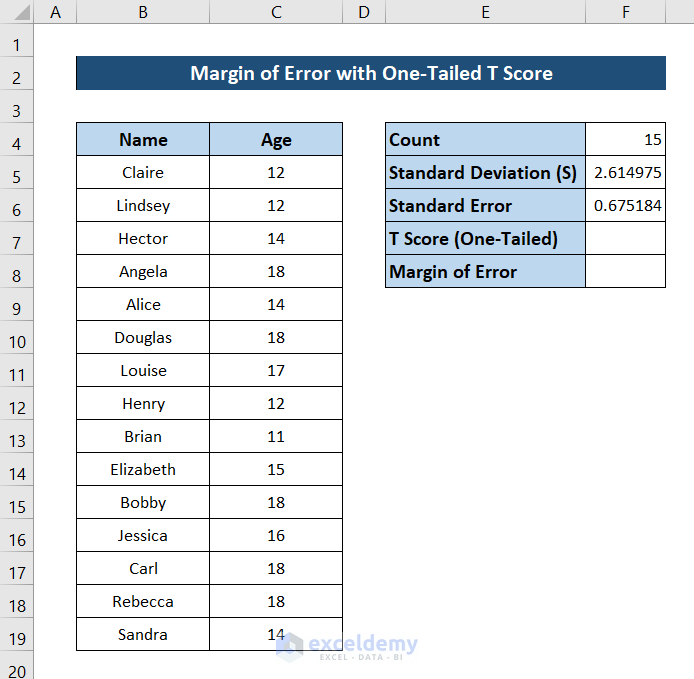
- Select cell F7 and add the following formula.
=T.INV(0.975,F4)
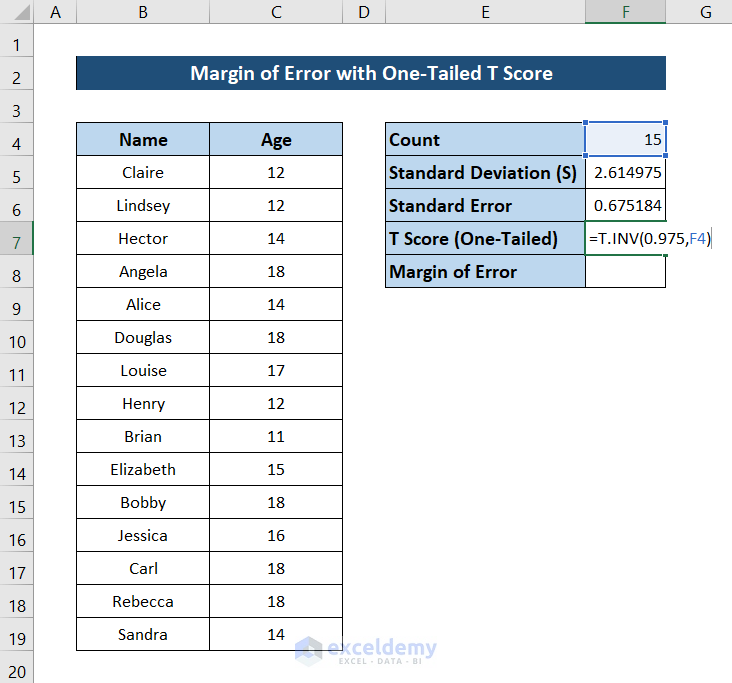
- Press Enter and you will have the T score of the data.
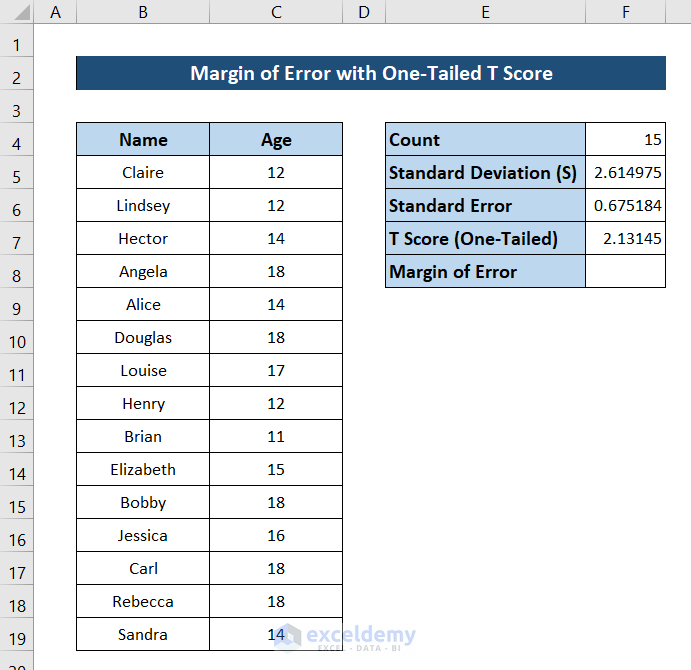
- Select cell F8 and add the following formula.
=F7*F6
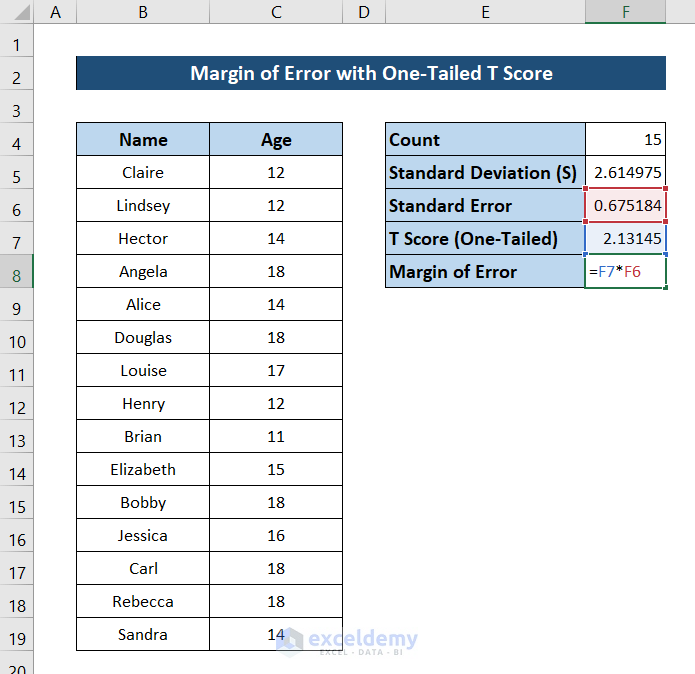
- Pressed Enter and you will finally have the margin of error.
Method 7 – Calculate Margin of Error with Two-Tailed T Score
Steps:
- Select cell F4 and add the following formula.
=COUNT(C5:C19)
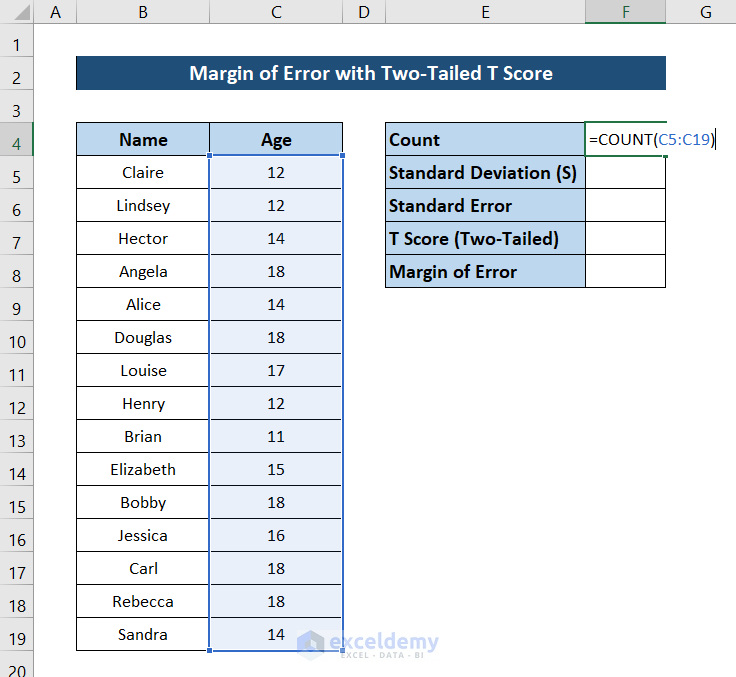
- Press Enter.
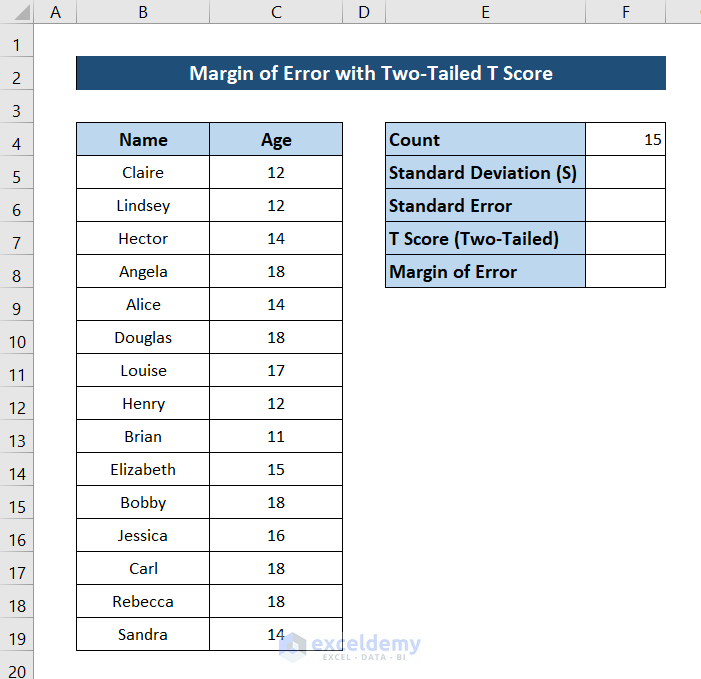
- Select cell F5 and add the following formula.
=STDEV.S(C5:C19)

- Press Enter.
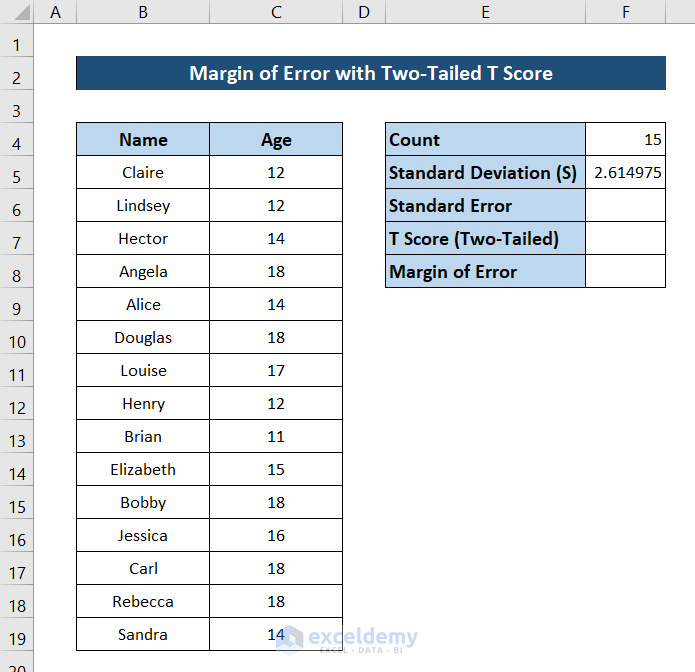
- Select cell F6 and add the following formula.
=F5/SQRT(F4)
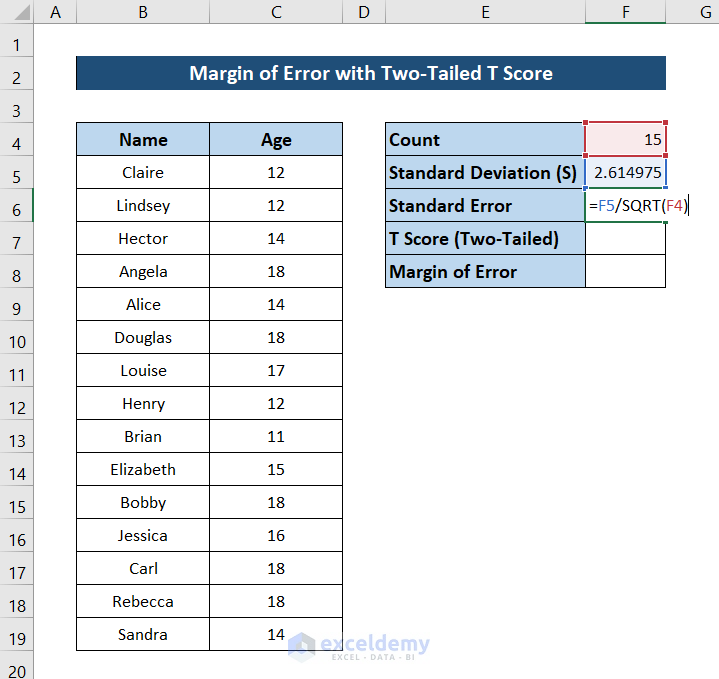
- Press Enter.
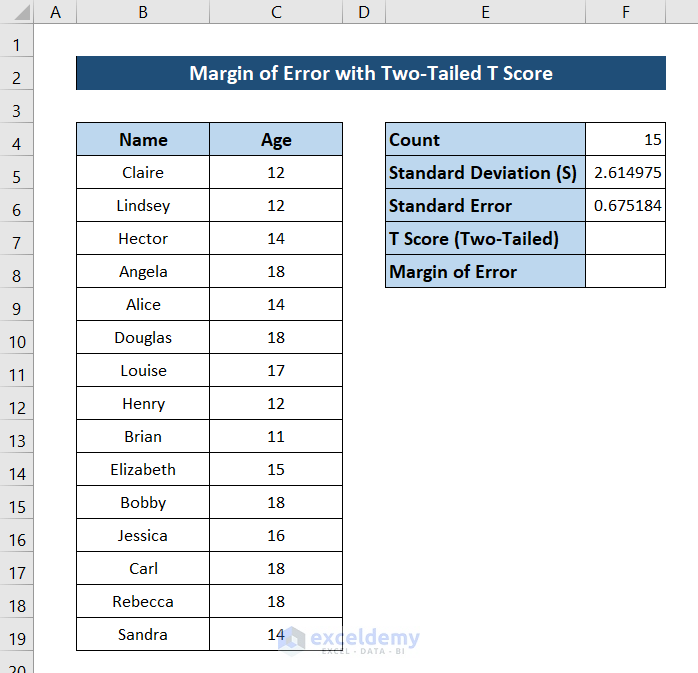
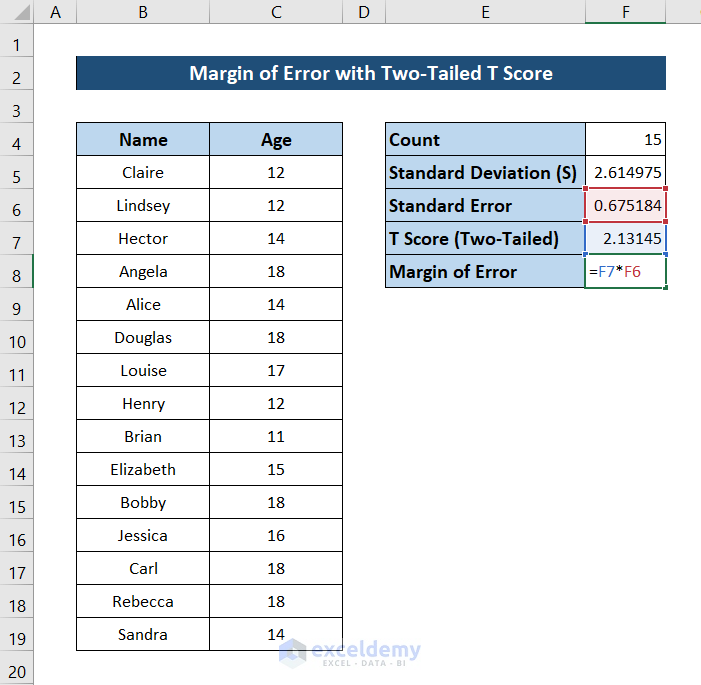
- To find the two-tailed T score, select cell F7 and add the following formula.
=T.INV.2T(0.05,F4)
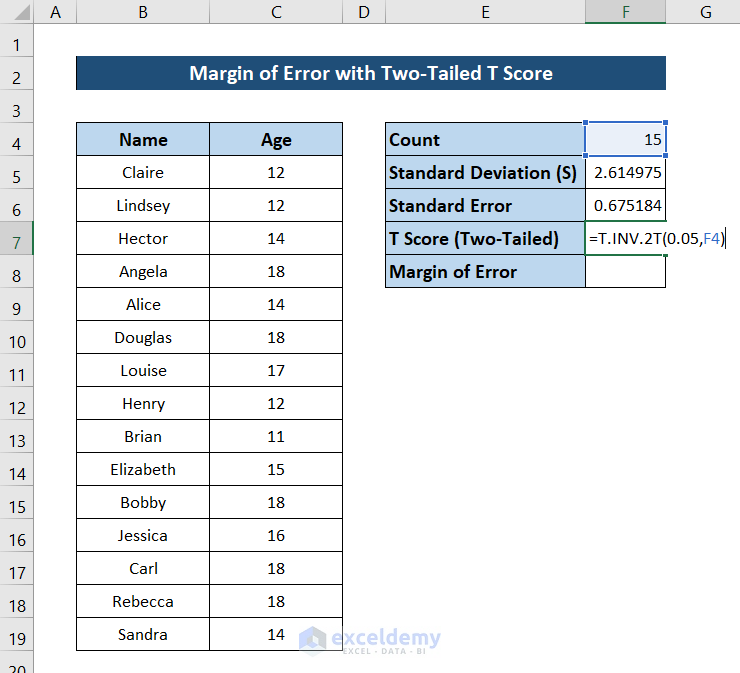
- Press Enter and you will have your two-tailed T score at an alpha value of 5.
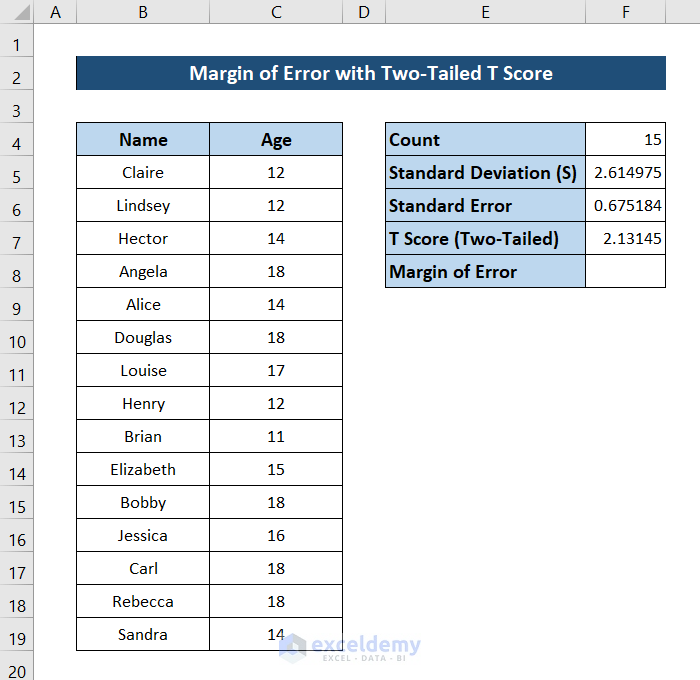
- Select cell F8 and add the following formula.
=F7*F6
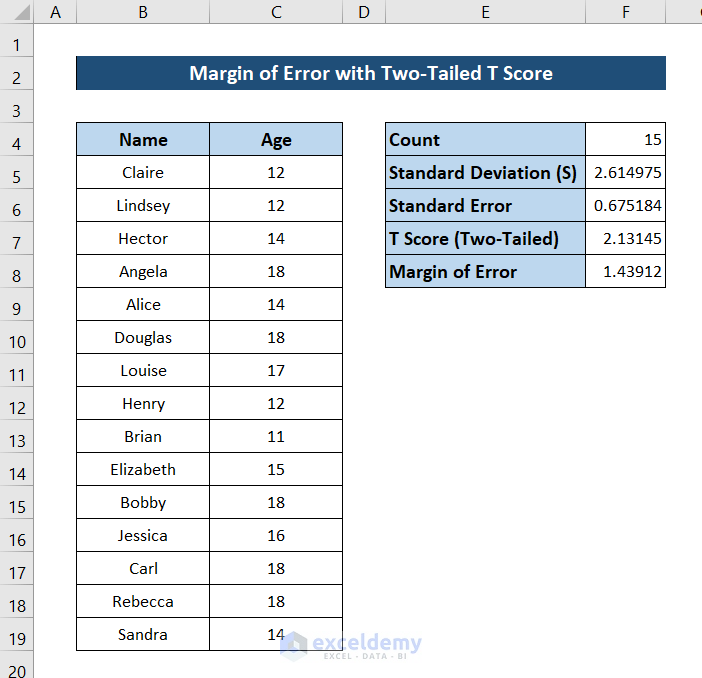
- Press Enter, you will have the margin of error of the dataset.
Download Practice Workbook
Related Articles
<< Go Back to Excel for Statistics | Learn Excel
Get FREE Advanced Excel Exercises with Solutions!

