What is NPS?
NPS, which stands for Net Promoter Score, provides insights into customer loyalty and satisfaction. It measures the difference between the number of promoters (satisfied customers) and detractors (unsatisfied customers) relative to the total number of respondents. You can easily calculate the NPS score using Microsoft Excel. In this article, we’ll demonstrate two methods to calculate NPS in Excel. If you’re curious, follow along with our practice workbook.
Overview of NPS Score
- Promoters: These are customers who are extremely satisfied with your goods or services. They actively promote your brand and encourage others to do the same.
- Passives: Passives fall between promoters and detractors. They are neutral or passive individuals who don’t exhibit strong emotions.
- Detractors: These are customers who give poor ratings. They are dissatisfied and unlikely to recommend your brand.
The mathematical expression of the NPS score is:

Moreover, you can also re-write the expression as shown below:

Dataset Overview
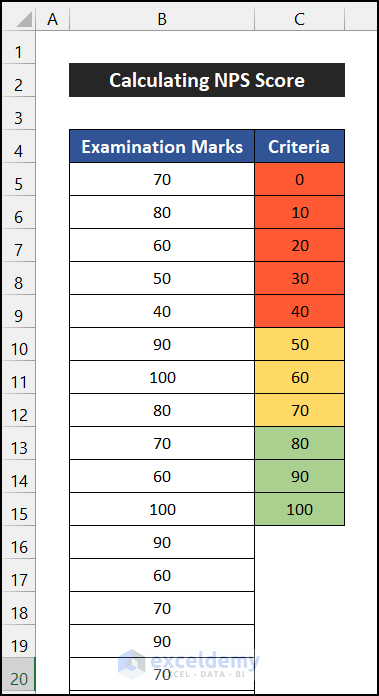
To illustrate these methods, we’ll examine the math test scores of 50 students listed in column B. Additionally, we’ll outline our NPS score criteria in column C. We define the Promoters’ range as 80-100, the Passive or Neutral range as 50-70, and the Detractors’ range as 0-40.
Method 1 – Using the Conventional Formula
- Calculate the number of students per criteria:
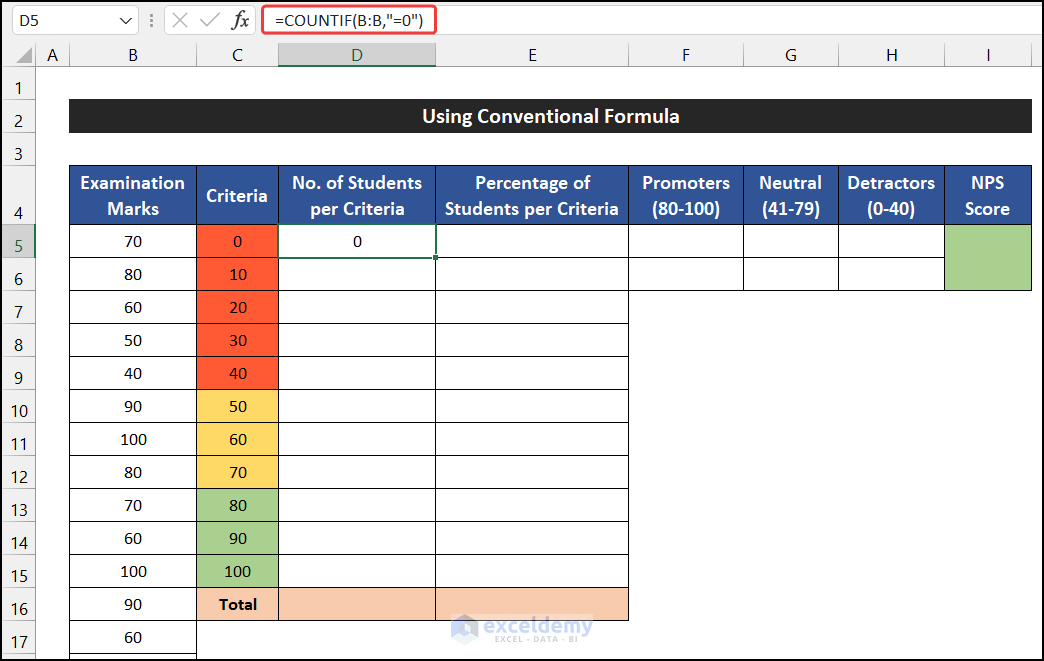
- Select cell D5.
- Use the COUNTIF function to count students with a score of 0:
=COUNTIF(B:B,"=0")
-
- Press Enter.
-
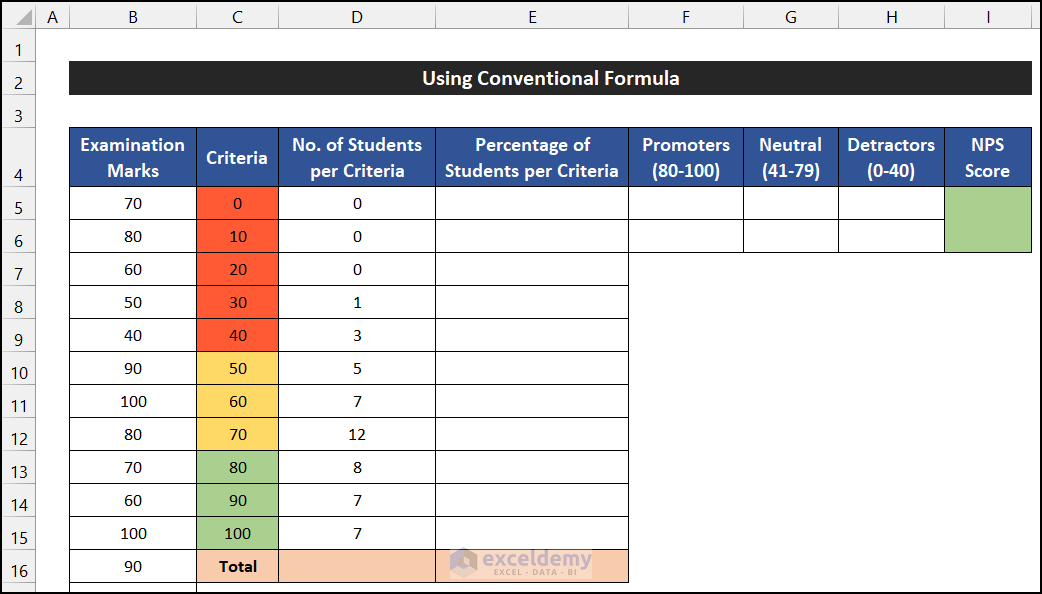
- Calculate counts for other score ranges.
-
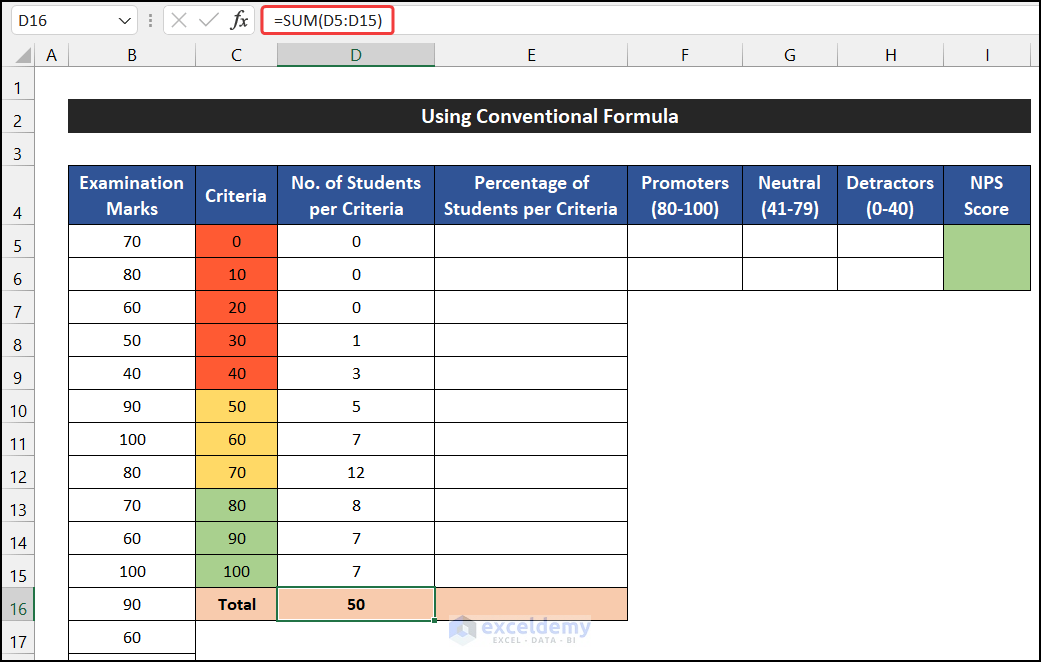
- In cell D16, use the SUM function to get the total number of students:
=SUM(D5:D15)
-
- Press Enter.
- Estimate the percentage of students per criteria:
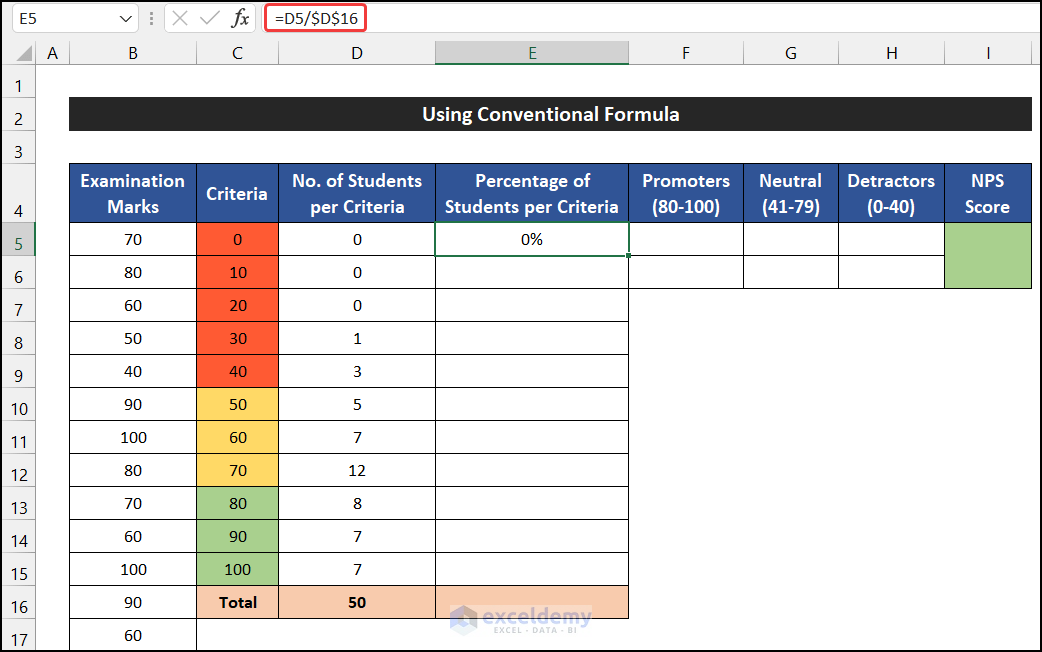
- In cell E5, calculate the percentage for the 0-score range:
=D5/$D$16
-
- Press Enter.
-
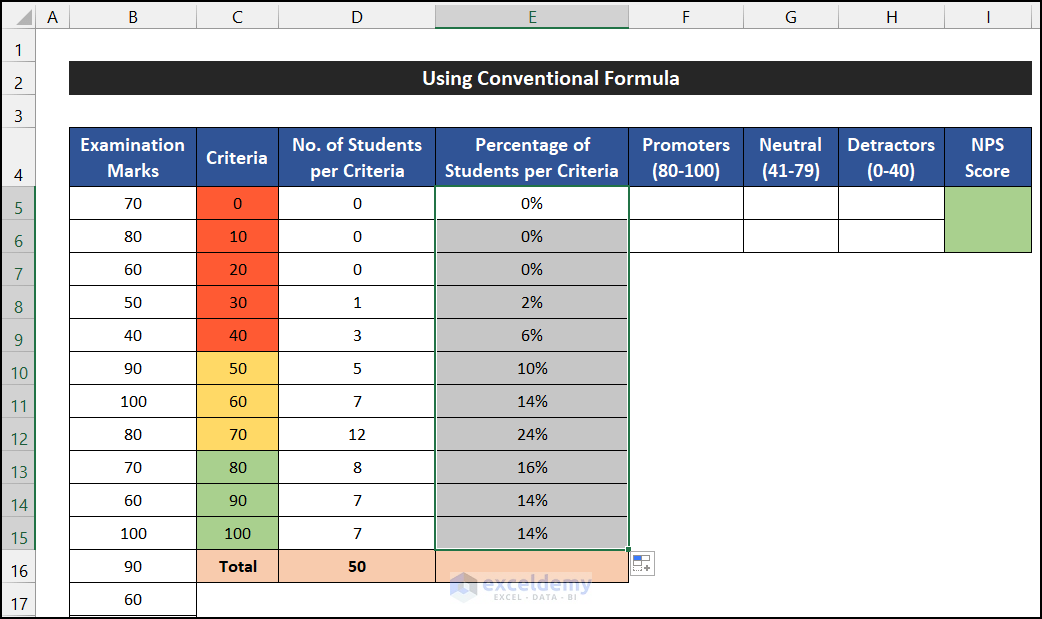
- Drag the formula down to fill cells E6 to E15.
-
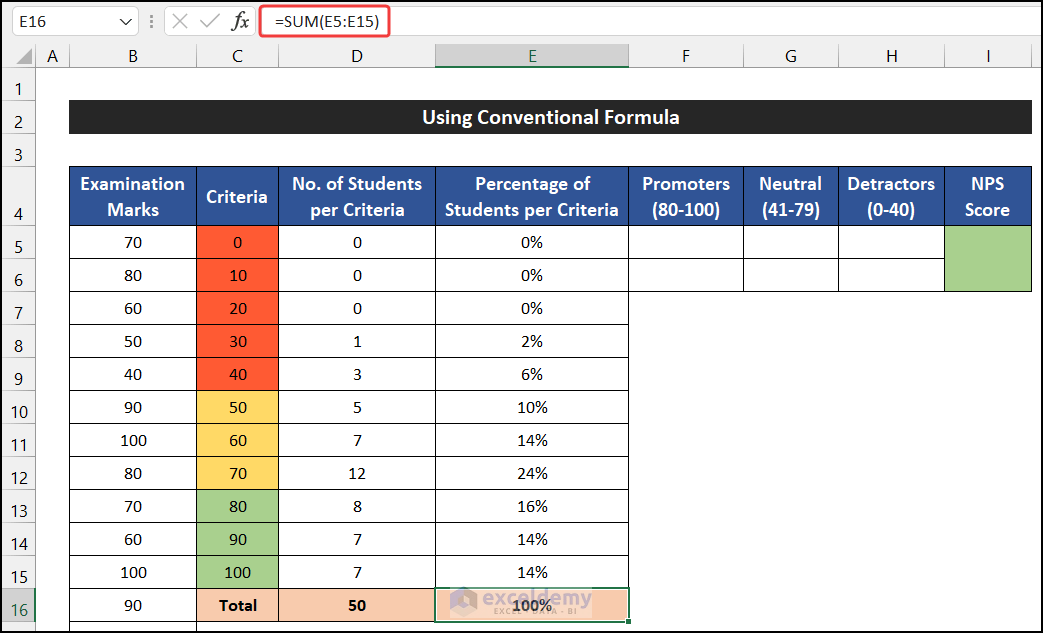
- In cell E16, use SUM to get the total percentage:
=SUM(E5:E15)
-
- Press the Enter.
- Evaluate the three NPS categories:
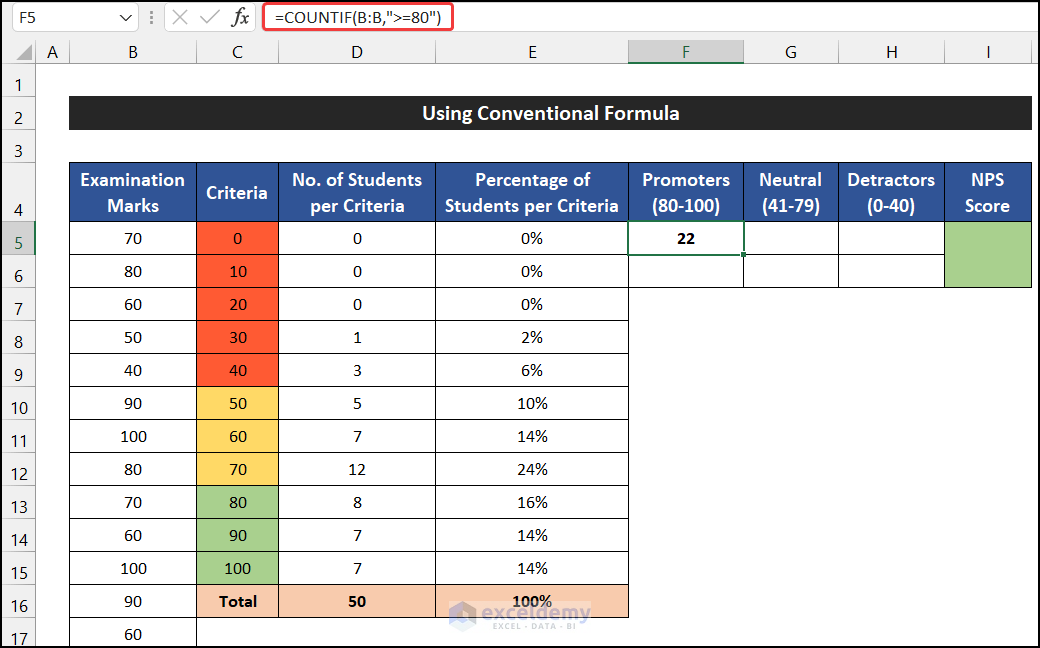
- Promoters (scores >= 80):
=COUNTIF(B:B,">=80")
-
- Press Enter.
-
- Detractors (scores <= 40):
=COUNTIF(B:B,"<=40")
-
- Press Enter.
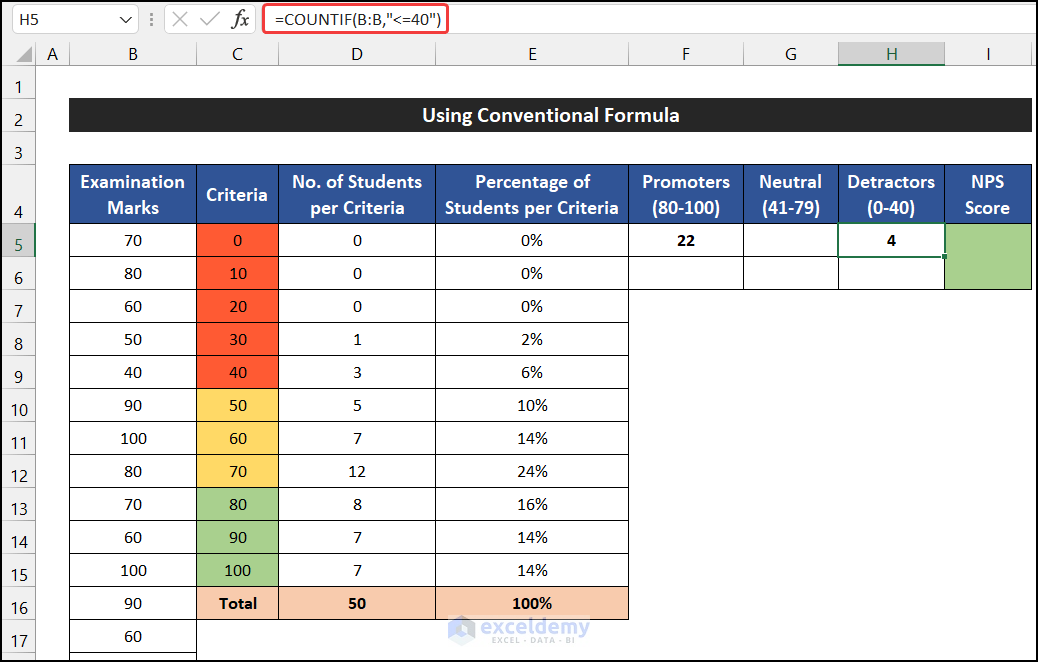
-
- Neutral (deduct from total):
=D16-F5-H5
-
- Press Enter.
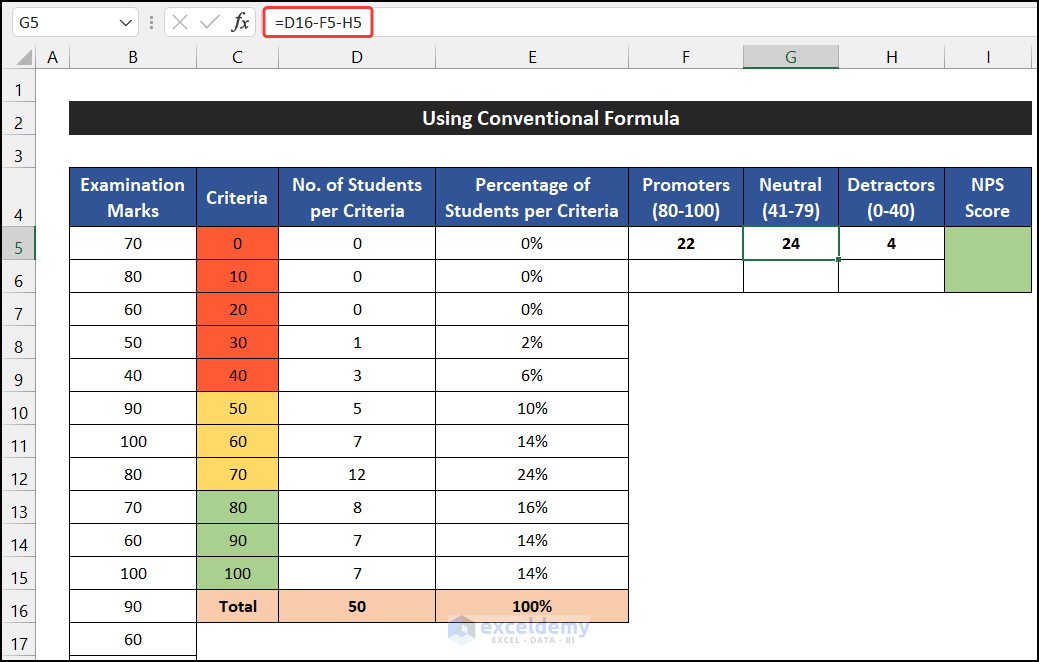
- Calculate the percentage of each category:
- Promoters:
=F5/$D$16
-
- Press Enter.
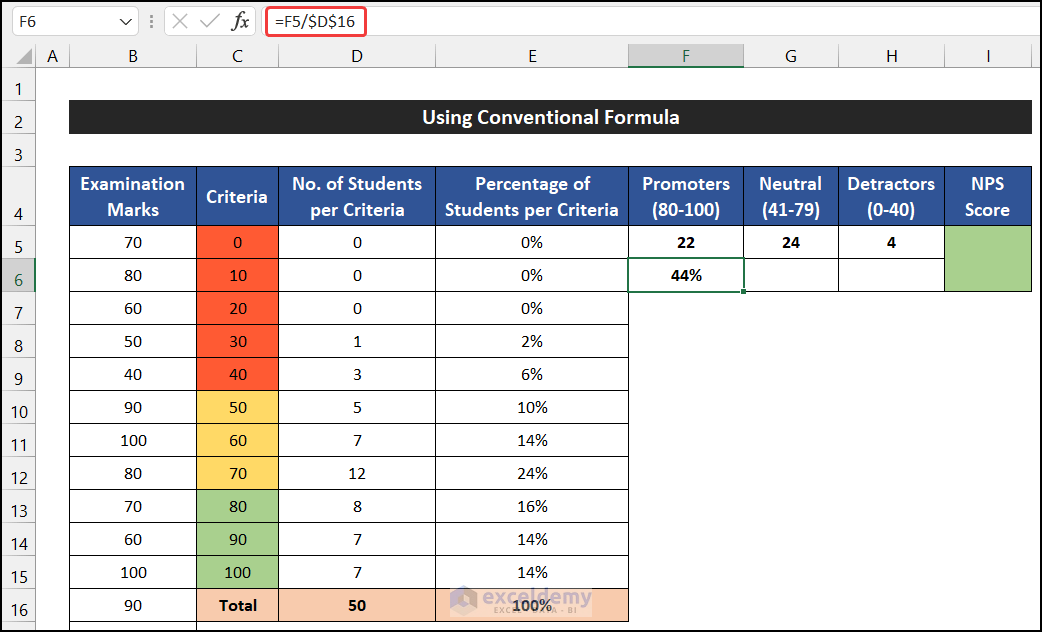
- Drag the Fill Handle icon to your right to copy the formula up to cell H6.
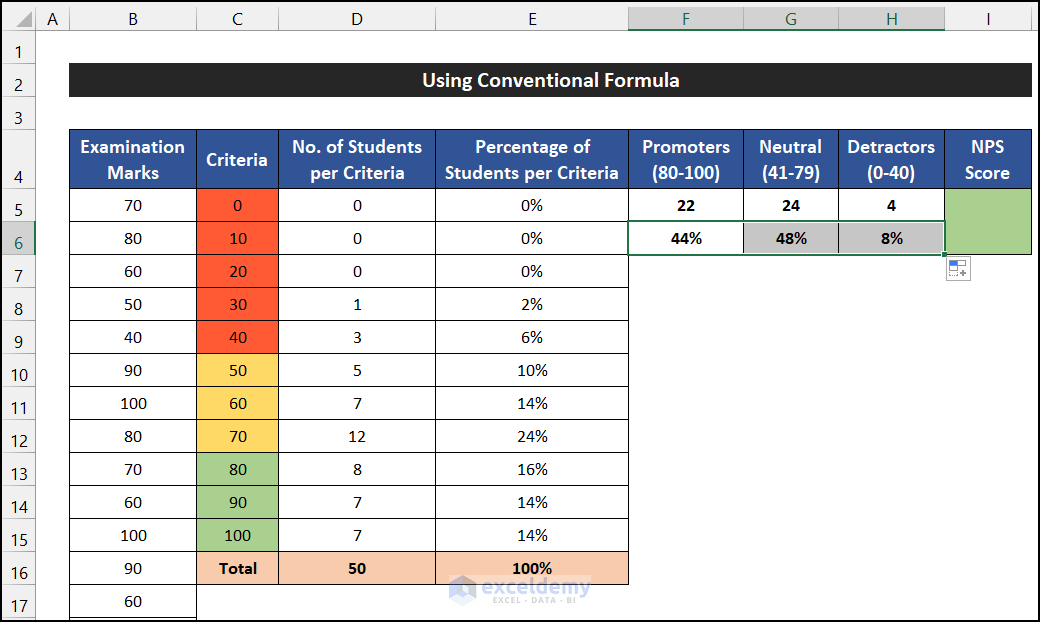
- Compute the NPS Score:
=((F5-H5)/D16)*100
- Press Enter.
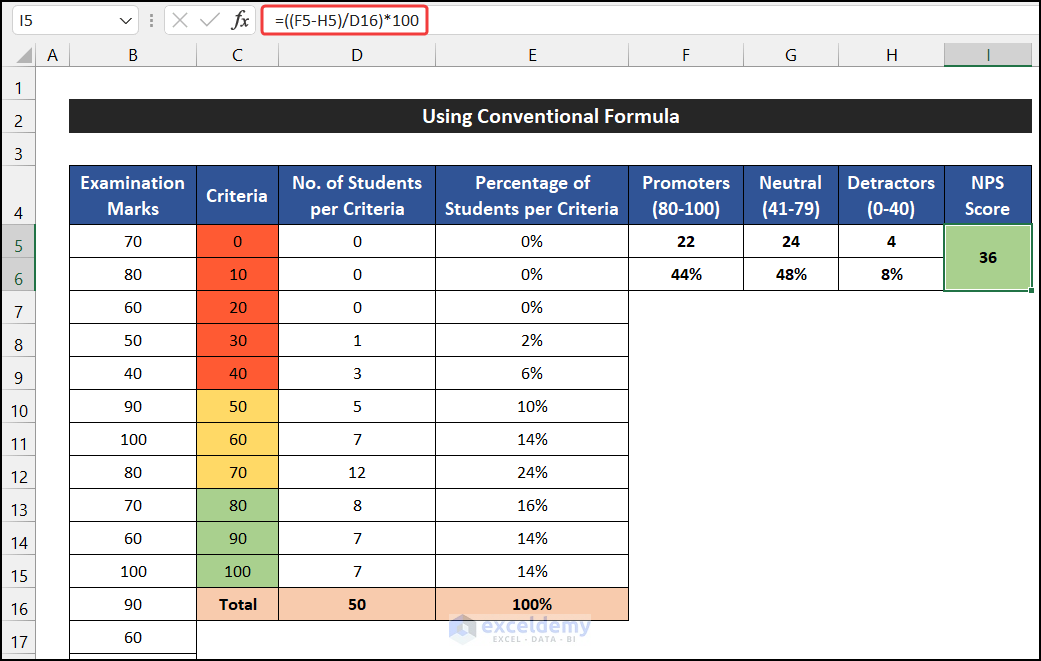
You will get the value of the NPS score.
Things You Should Know
To calculate the Net Promoter Score (NPS), focus on the percentage values of Promoters and Detractors, found in cells F6 and H6. The difference between these two percentages directly corresponds to the NPS score.
Method 2 – Combining COUNTIF and COUNT Functions
In this process, we are going to use the COUNTIF and COUNT functions to calculate the NPS score.
Follow these steps to implement this method:
- Select cell D5.
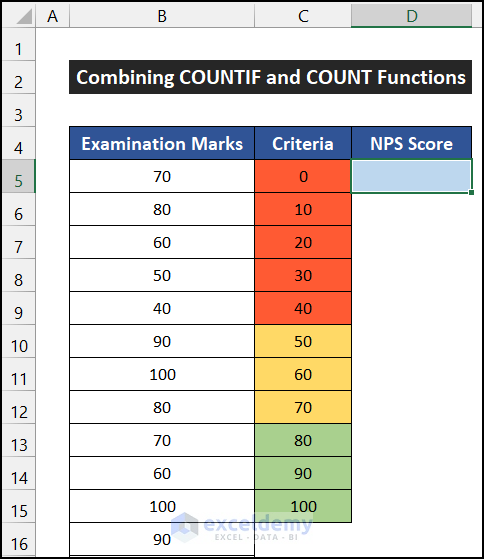
- Enter the following formula into the cell:
=((COUNTIF(B:B,">=80")-COUNTIF(B:B,"<=40"))/COUNT(B:B))*100
- Press Enter to execute the formula.
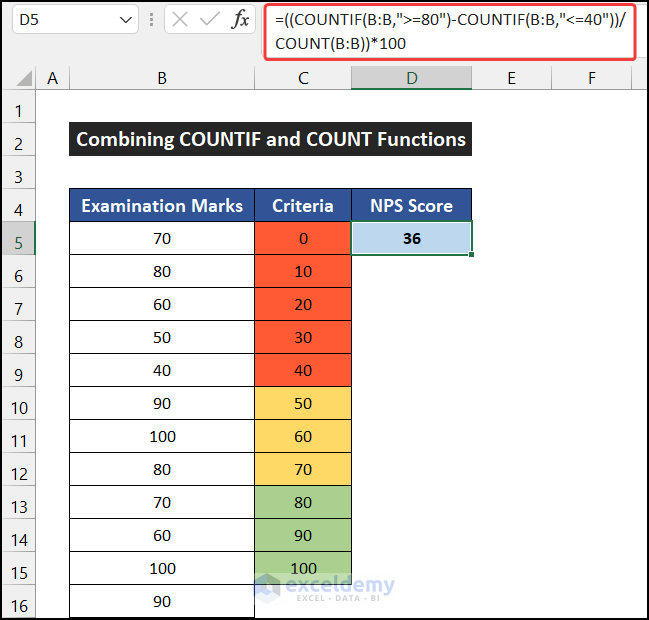
- The NPS score will be displayed.
Breakdown of the Formula
We are breaking down the formula for cell D5.
- COUNTIF(B:B,”>=80″): This function tallies the occurrences greater than or equal to 80 in column B. In this case, the count is 22.
- COUNTIF(B:B,”<=40″): Similarly, this function counts the instances less than or equal to 40 in column B, yielding a count of 4 for this cell.
- COUNT(B:B): The COUNT function enumerates the total entities in column B, which amounts to 50 in this context.
- ((COUNTIF(B:B,”>=80″)-COUNTIF(B:B,”<=40″))/COUNT(B:B))*100: Ultimately, this formula subtracts the count of values less than or equal to 40 from those greater than or equal to 80, then divides the result by the total count and multiplies by 100 to derive the NPS score. In this instance, the score is 36.
Download Practice Workbook
You can download the practice workbook from here:
<< Go Back to Scoring | Formula List | Learn Excel
Get FREE Advanced Excel Exercises with Solutions!

