Data consolidation means merging data together from different sources, for example to make a final report, we might need to consolidate data from multiple ranges in Excel. In this article, we will describe 2 ways to consolidate data from multiple ranges in Excel using built-in Excel features.
Suppose we have the two datasets below, Mid-Term Result-2021 & Annual Result-2021. We will use these two datasets to demonstrate how to consolidate information from multiple ranges in Excel.

Method 1 – Using the Consolidate Feature to Consolidate Data from Multiple Ranges
The Consolidate command is a built-in command in the main ribbon, used to merge data from different sources. Let’s use it to consolidate our data.
Steps:
- Select cell G6 as the destination cell address.
- Go to Data ➤ Data Tools ➤ Consolidate.
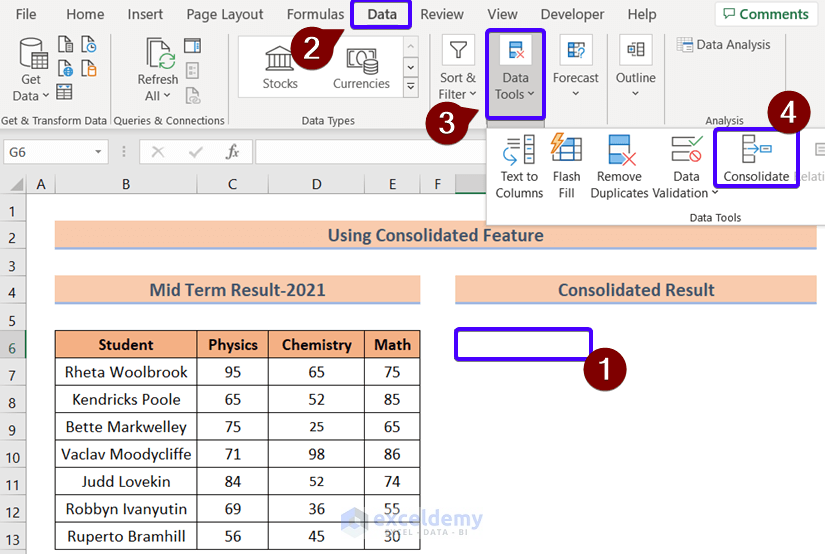
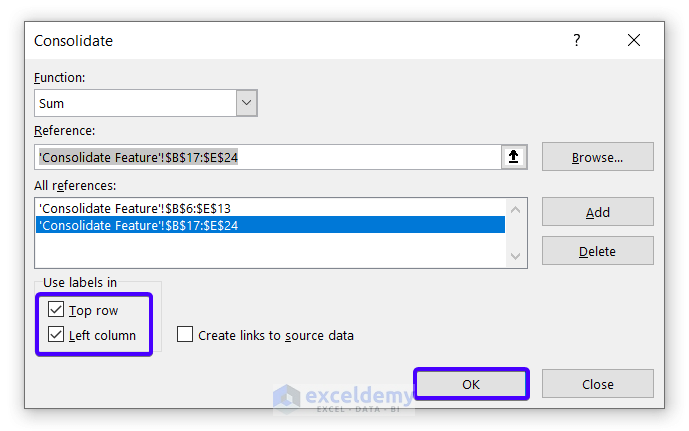
The Consolidate dialog box will open.
- Select Sum from the Function drop-down menu.
- Select the first range to consolidate in the Reference (the whole range Mid Term Result-2021 here).
- Click on Add.
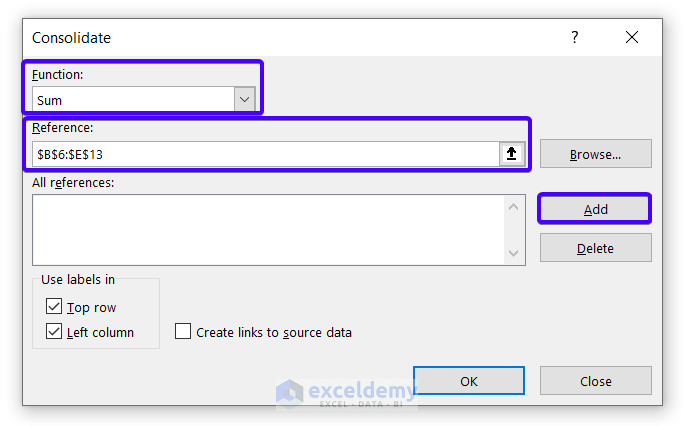
The first range will appear in the All reference box.
- Click on the upper-arrow button next to the Reference input box.
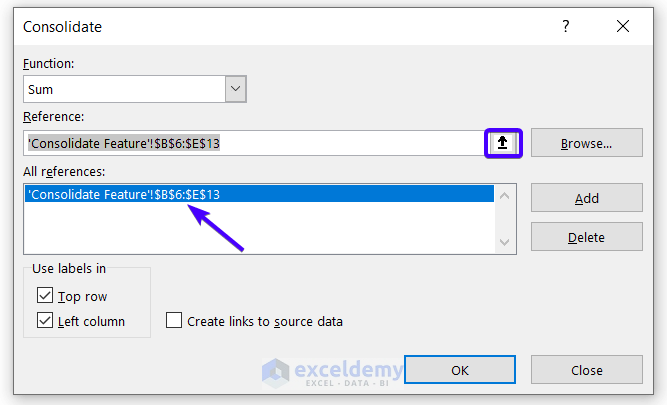
- Insert the second range to consolidate in the Reference box (the whole Annual Result-2021 dataset).
- Click on the Add button again.
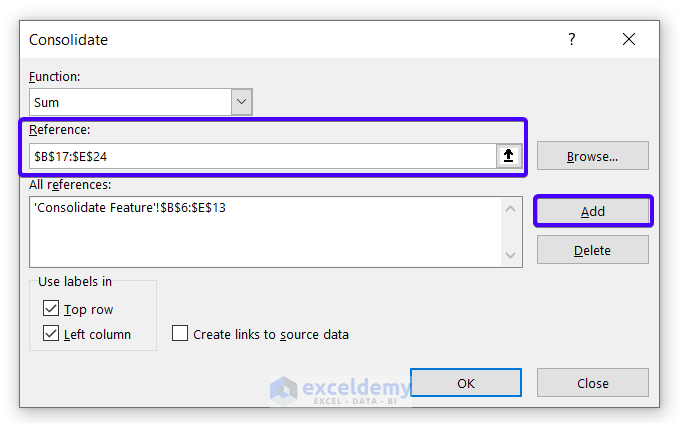
The second range will now also appear in the All references box.
- Select the Top row and Left column options under ‘Use labels in’, which will add the data with the correct labels (assuming that the labels are in the first row and column in the table).
- Click OK.
The two ranges will be consolidated at the specified destination. In the consolidated results, the marks will be summed from the two ranges.

Method 2 – Consolidating Data from Multiple Ranges Using a Pivot Table
Another way to consolidate data from multiple ranges is to use the Pivot Table.
Steps:
- Select a blank cell.
- Press ALT + D + P (i.e. while holding down the ALT key, press D and then P).
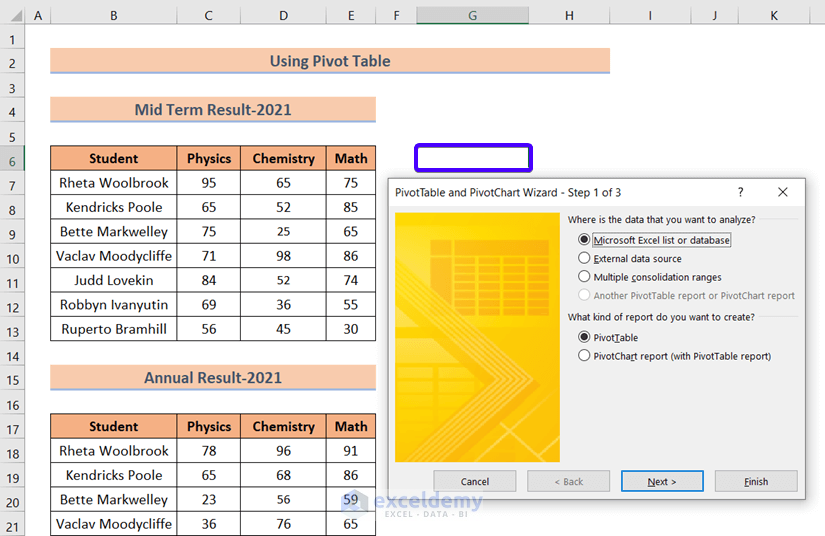
The PivotTable and PivotChart Wizard dialog box will open.
- Select Multiple Consolidation Ranges.
- Select PivotTable.
- Click on Next.
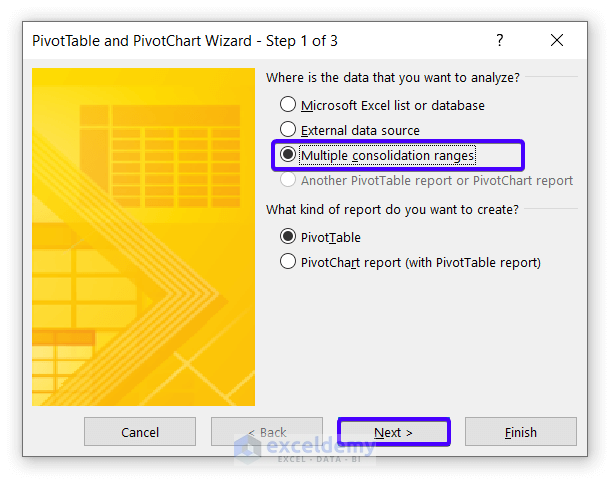
- Select ‘Create a single page field for me’.
- Click on the Next button again.

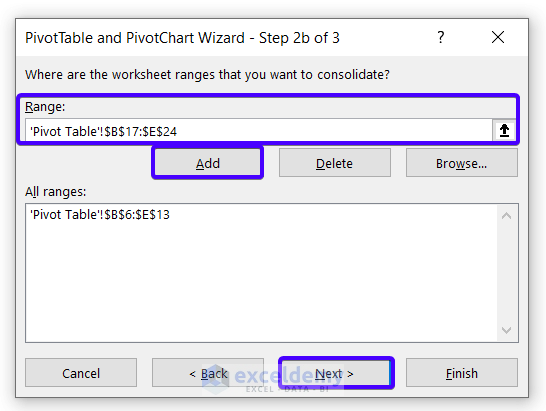
- Insert the first range to consolidate in the Range (the whole Mid-Term Result-2021 dataset).
- Click on Add.
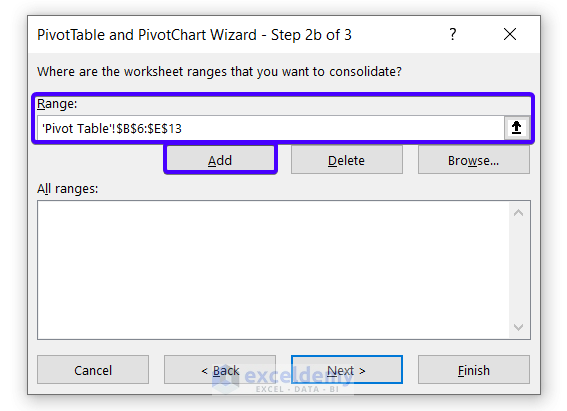
- Select the second range to consolidate in the Range (the whole Annual Result-2021 dataset).
- Click on Add.
- Click on Next.
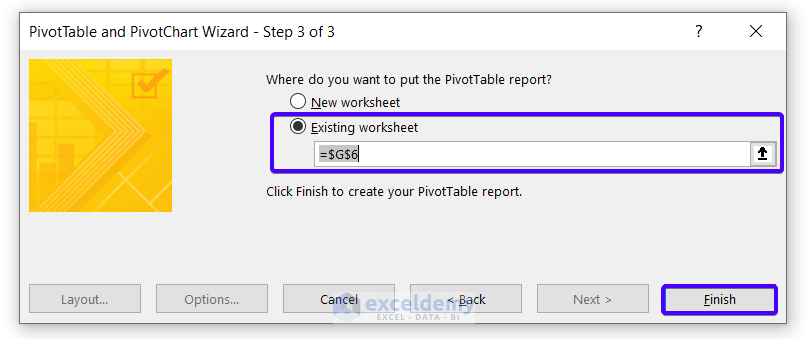
Now we select the destination for the Pivot Table. The options are in a New worksheet or the Existing worksheet.
- For this example, select Existing worksheet and insert a destination cell address.
- Click on Finish.
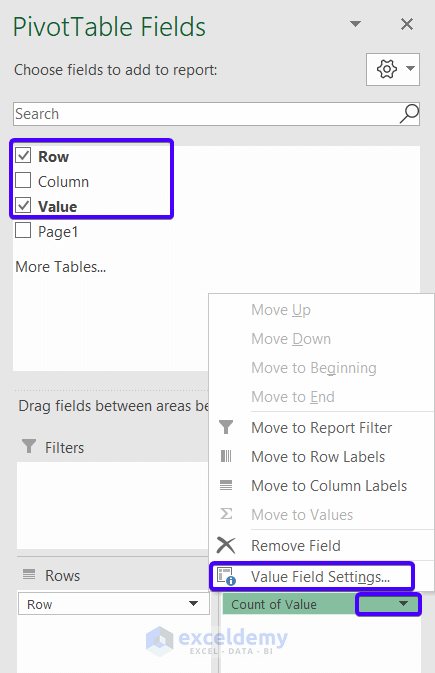
- Select the Row and Value options in the PivotTable Fields dialog box.
- Click on the drop-down arrow beside Count of Value.
- Select Value Field Settings.
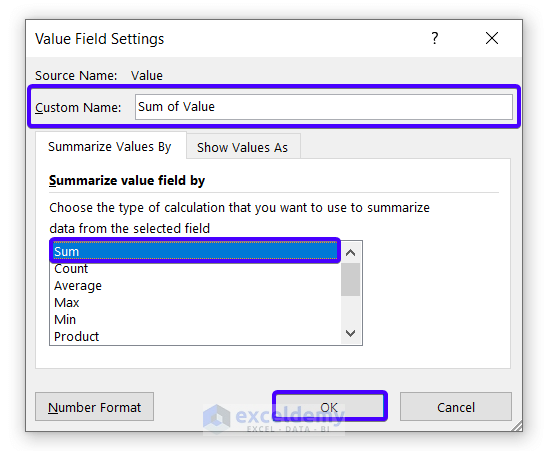
The Value Field Settings dialog box appears.
- Select Sum from the ‘Summarize value field by’ drop-down.
- Click OK.
The consolidation result is returned. In the Row Labels column are the student names, with the consolidated marks of each student in Sum of Value.

Download Practice Workbook
You can download the Excel file from the following link and practice along with it.
<< Go Back To Consolidation in Excel | Merge Sheets in Excel | Merge in Excel | Learn Excel
Get FREE Advanced Excel Exercises with Solutions!

