What Is an Expense Report?
An expense report is a document that records all expenses incurred by an organization. The common elements included in an expense report are as follows:
- Date of Expense
- Expense Type (such as Hotel, Transport, Meal, Miscellaneous, etc.)
- Amount of Expense
- Subtotal for each expense type
- Amount of Due and Advance Payment
- Purpose of Expense
- Responsible Department
It’s important to note that the format of an expense report may vary across different organizations. Each organization can customize the report by adding or modifying elements according to their specific needs.
Advantages of Using Expense Reports
Using an expense report offers several advantages:
- Expense Tracking: It helps you keep track of expenses, making cost control more efficient.
- Budget Information: Provides valuable data for creating and managing budgets.
- Tax Compliance: Simplifies tax payments and deductions.
Step 1 – Turning Off Gridlines in Excel
- Open an Excel file.
- Go to the View tab.
- Uncheck the Gridlines checkbox in the Show group.

Step 2 – Adding Basic Information
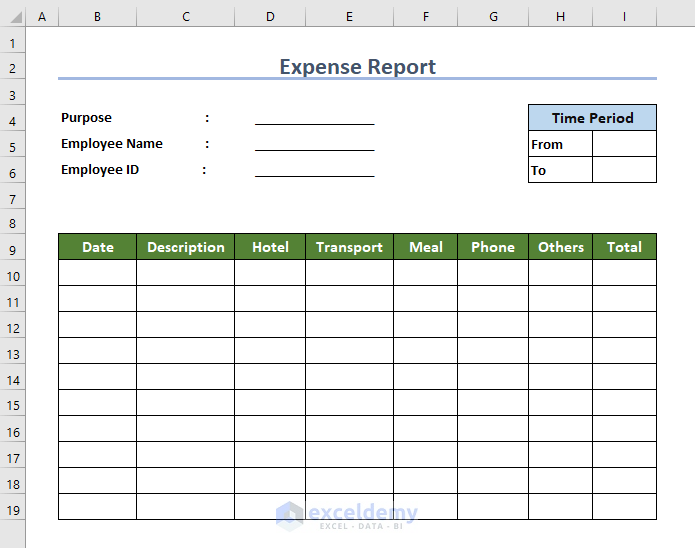
- Add a Title for the report (e.g., Expense Report).
- Include fields for Purpose, Employee Name, Employee ID, and Time Period.

Step 3 – Adding Columns for Date, Description, and Expenses
- Create data columns for various expense types (e.g., Hotel, Transportation, Meals, Phone bills, Others).
Step 4 – Converting Data into an Excel Table
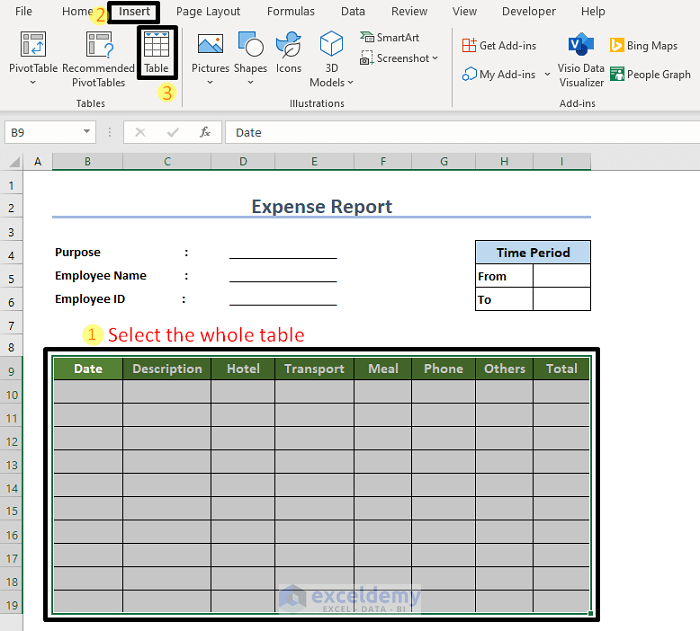
- Select the range of cells containing your data (e.g., B9:I19).
- Go to the Insert tab.
- Choose Table from the Tables group.
- In the Create Table window, ensure the My table has headers checkbox is marked.
- Click OK.


Step 5 – Introducing Subtotal Row and Turning Off Filter Button
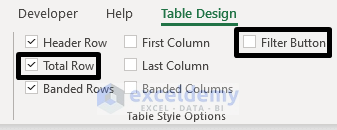
- Go to the Table Design tab.
- Uncheck the Filter Button and check the Total Row option.
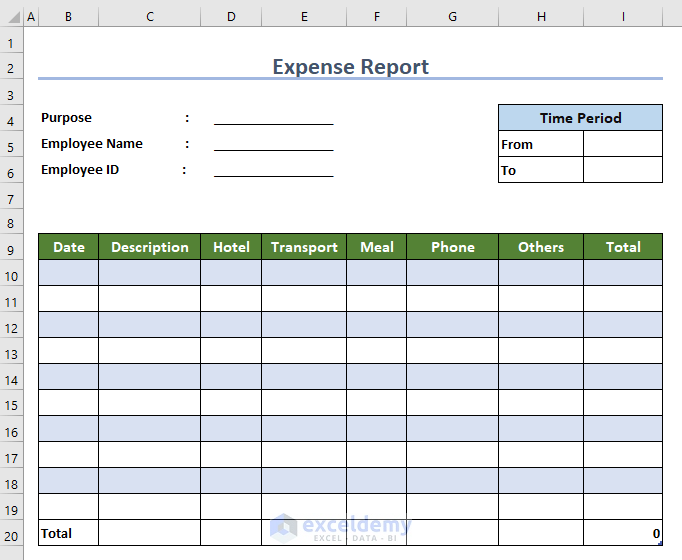
- A subtotal row will appear at the bottom of the table.
Step 6 – Formatting Cells
- Format date cells (from the Time Period and Date columns) as desired (e.g., choose a date format).
- Format other cells (Hotel, Transport, Meal, Phone, Others, and Total) as Accounting format.
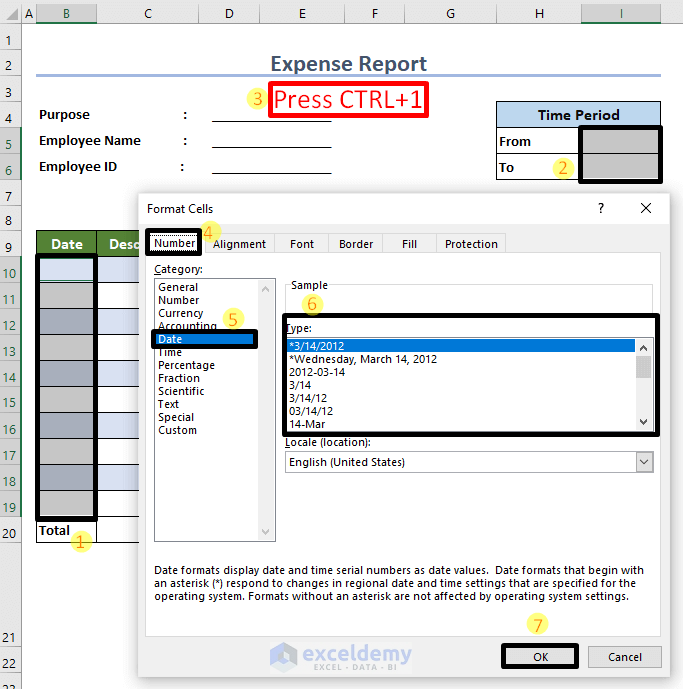
Step 7 – Applying the Excel SUM Function
- In the Total column, enter the following formula in the first cell:
=SUM(Table1[@[Hotel]:[Others]])
This formula calculates the total cost for each date.
- Press Enter, and the formula will automatically fill down the column.
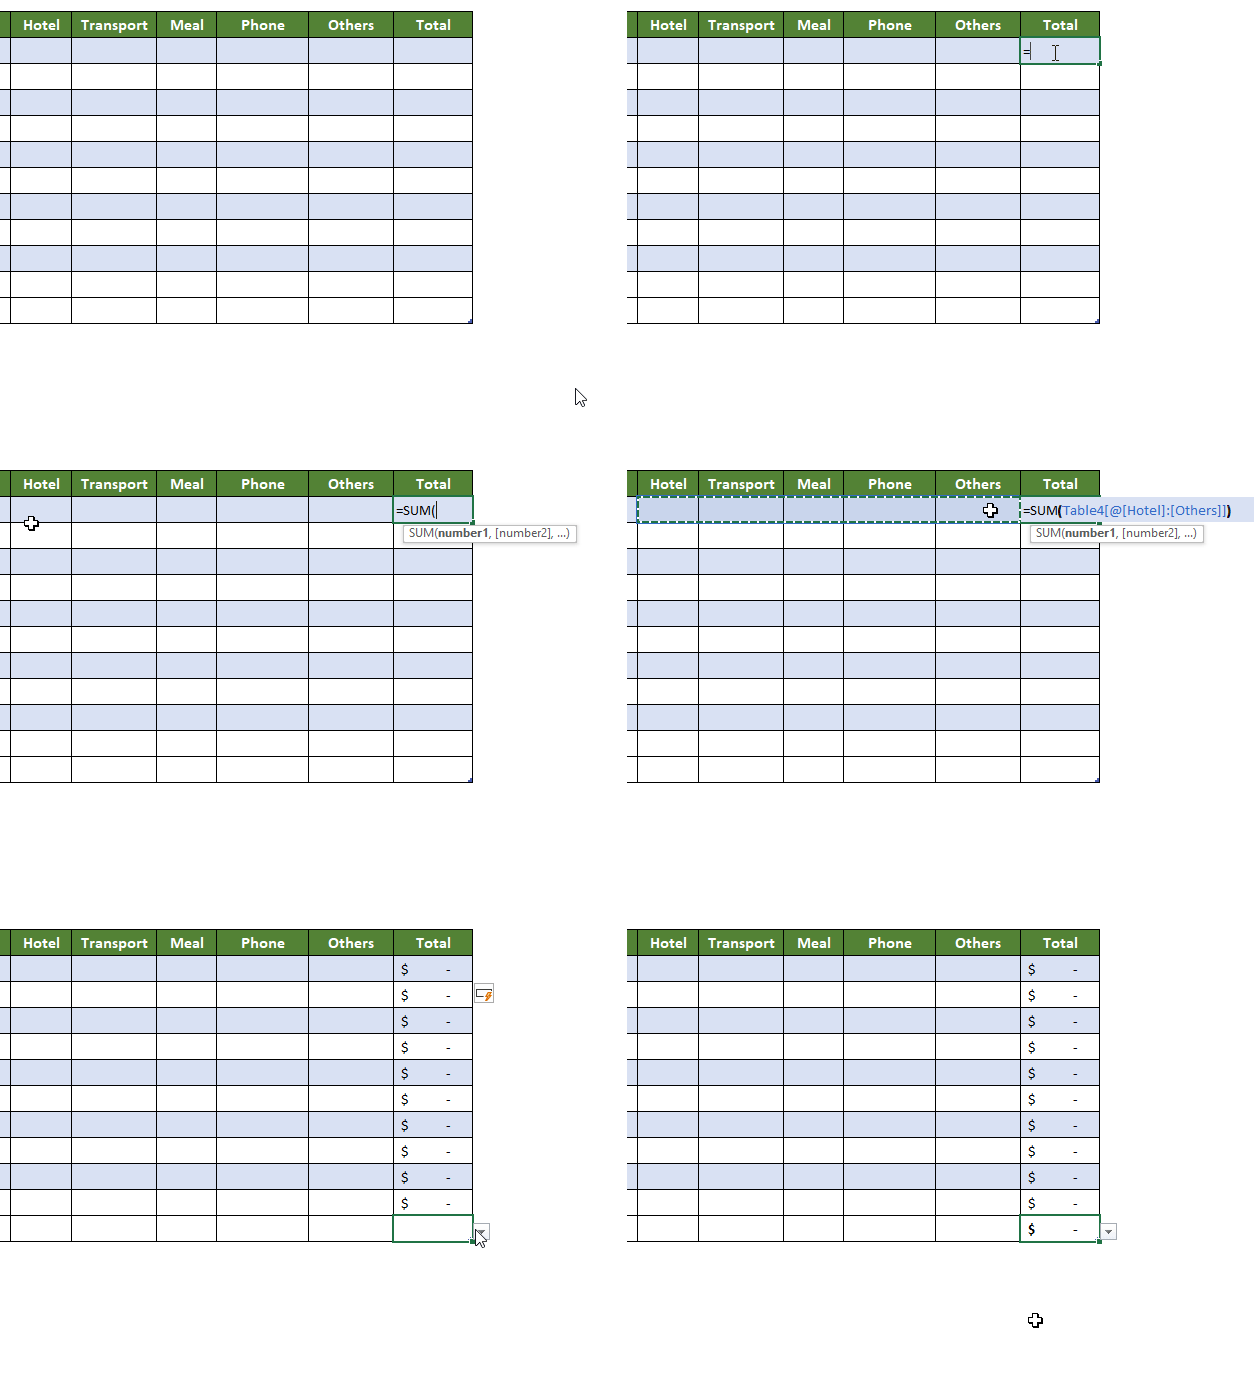
Step 8 – Inserting Expenses and Other Data
- Enter your expense data into the data columns.
- The row-wise totals will appear in the Total column.

Step 9 – Generating Subtotal for Each Expense Type
- Go to the Subtotal row of the Hotel column.
- Click the down arrow to reveal a list of operations.
- Choose the Sum operation.
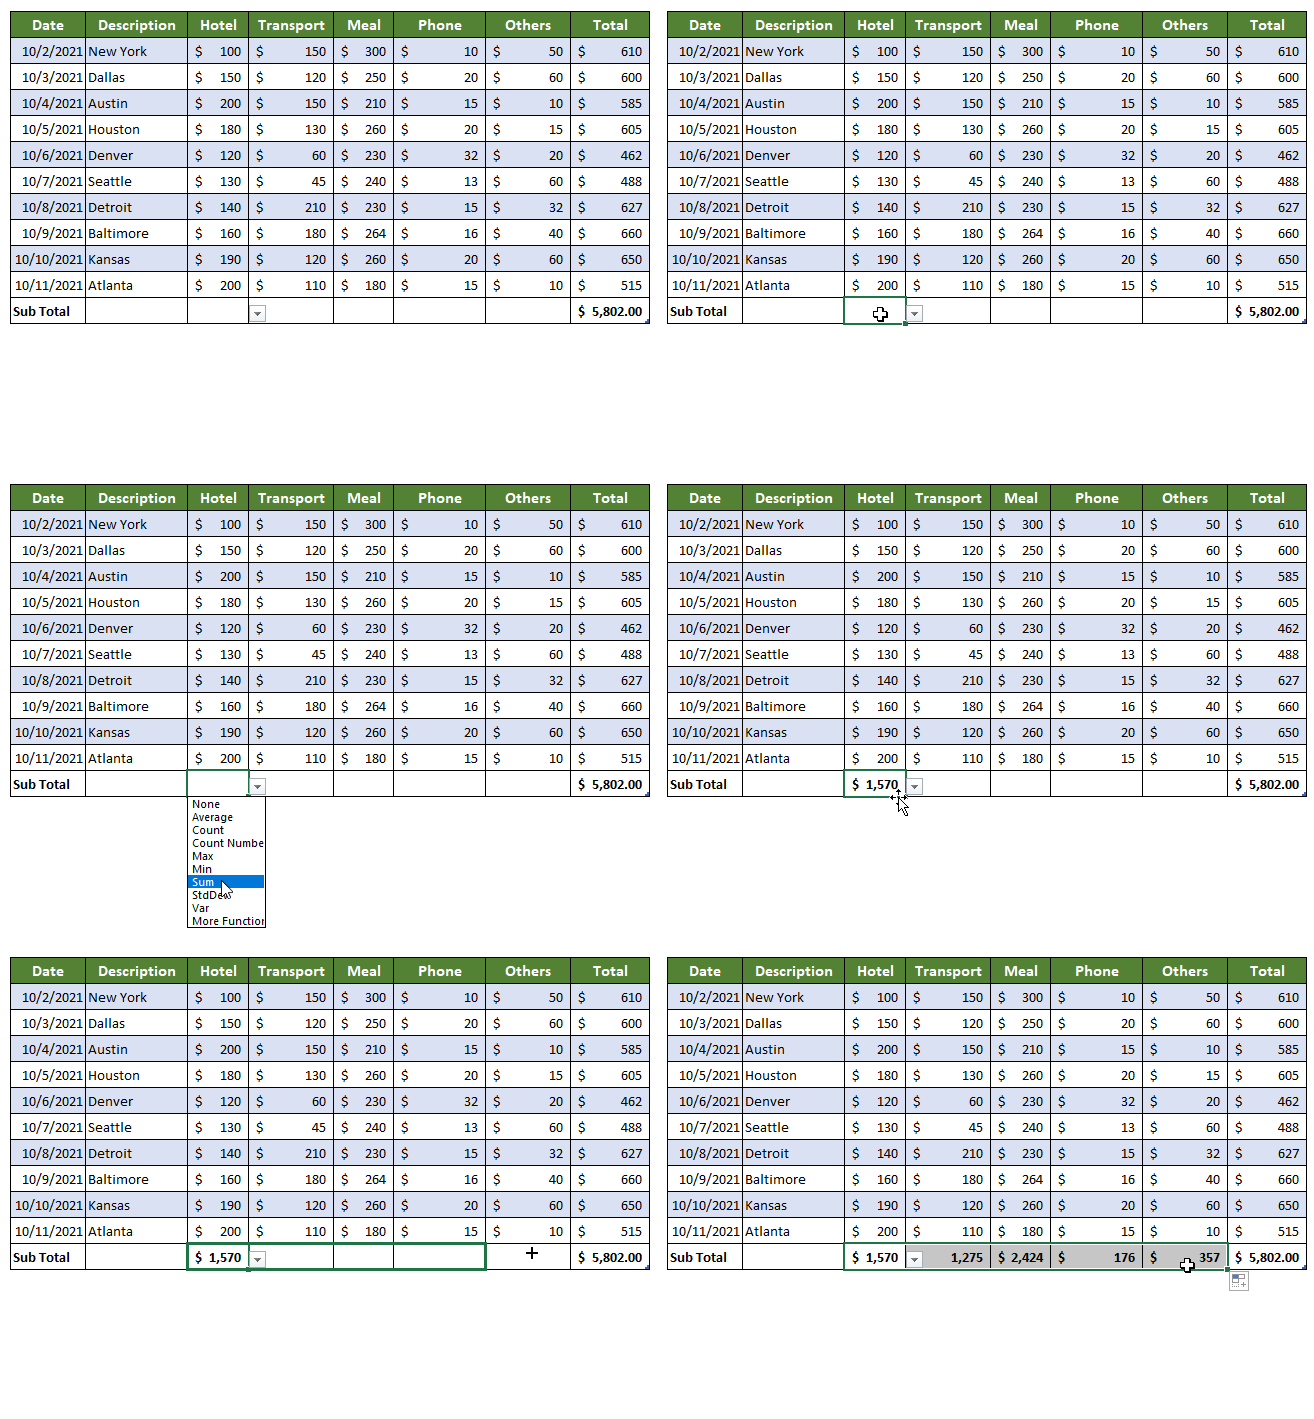
- Drag the Fill Handle icon to the right to calculate subtotals for all expense types.
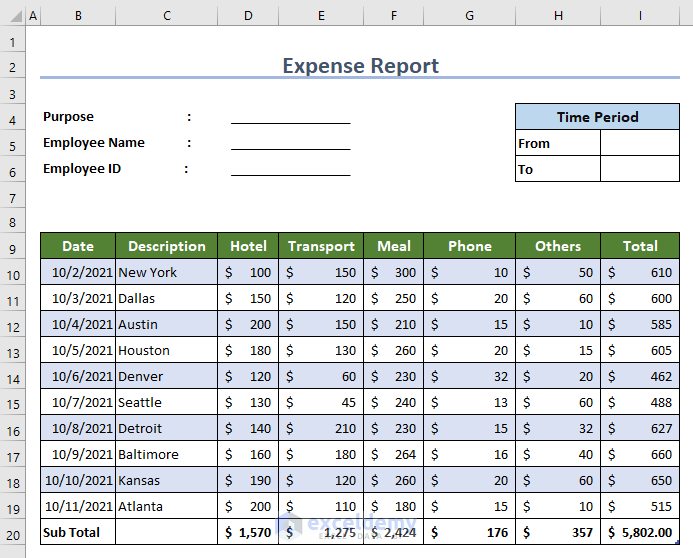
Step 10 – Adding Rows for Final Calculation
In this section, we’ll add two more rows for the final bill calculation. Before any reimbursement, employees may receive an advance payment. Let’s address this:
- Add Advances and Reimbursement rows below the subtotal row.
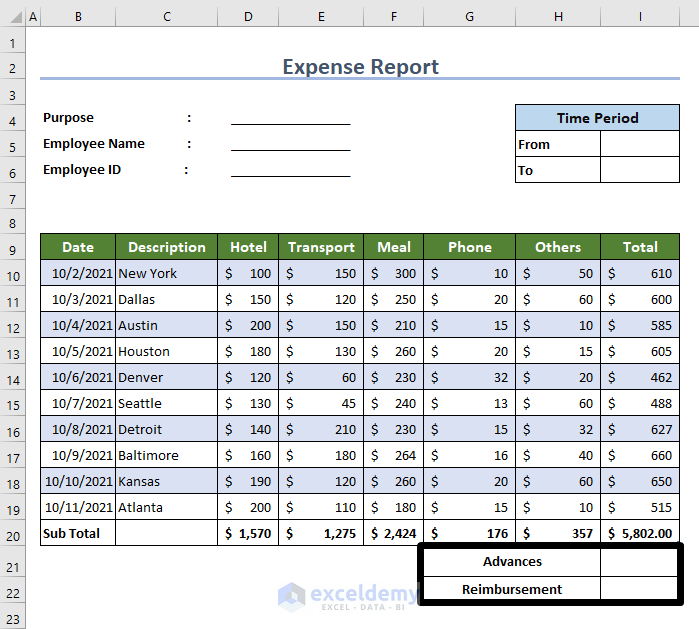
- Enter the advance amount in cell I21.
- In cell I22, enter the following formula:
=Table1[[#Totals],[Total]]-I21

- Press Enter to get the result.
Step 11 – Keeping a Space for Authorization in the Expense Report
You can add a space for authorization, indicating that this expense report will be accepted after approval by a responsible person.

Remember that you have to attach all expense documents while submitting this report to the authority.
Download Free Template
You can download the following free template.
Related Articles
- How to Make Daily Activity Report in Excel
- How to Create an Income and Expense Report in Excel
- How to Make Production Report in Excel
- How to Make Daily Production Report in Excel
- How to Make Monthly Report in Excel
- How to Make a Monthly Expense Report in Excel
<< Go Back to Report in Excel | Learn Excel
Get FREE Advanced Excel Exercises with Solutions!

