1. Sorting in Excel
Sorting is the process of arranging data in a particular order.
1.1. Sorting Methods
You can:
- Sort text data in alphabetical order.
- Sort numeric data in numerical order.
There are Custom Sort methods, such as Sort by Cell Color, Font Color, Conditional Formatting Icon.
1.2. Sorting Examples in Excel
1.2.1. Sort Text Data into Alphabetical Order
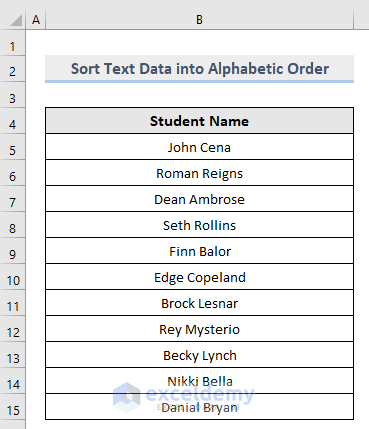
Consider the following dataset. In Column B, there are Students’ Names in random order.
1.2.1.1. Sort Alphabetic Data in Ascending Order
Steps:
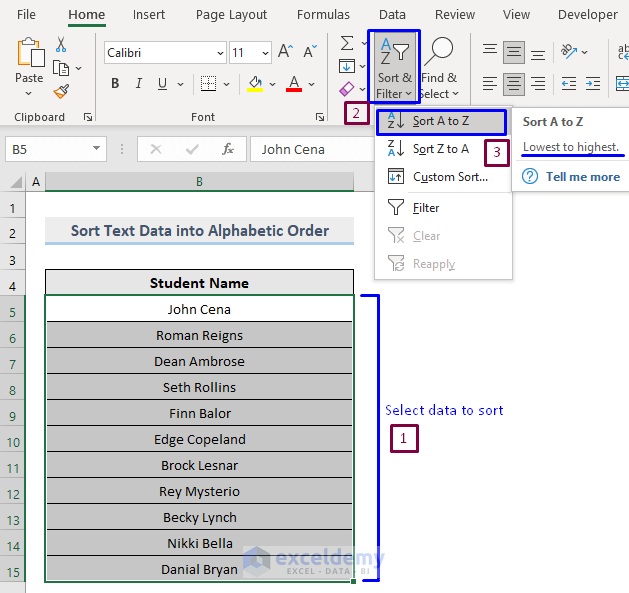
- Select the data to sort.
- In the Home tab, select Sort & Filter -> Sort A to Z in Editing.
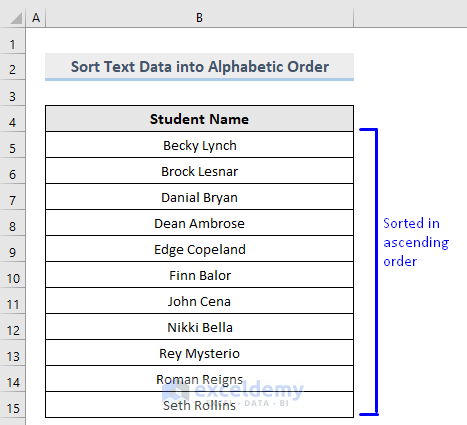
Text data will be sorted in ascending order.
Read More: Advantages of Sorting Data in Excel
1.2.1.2. Sort Alphabetic Data in Descending Order
Steps:
- Select the data to sort.
- In the Home tab, select Sort & Filter -> Sort Z to A in Editing.
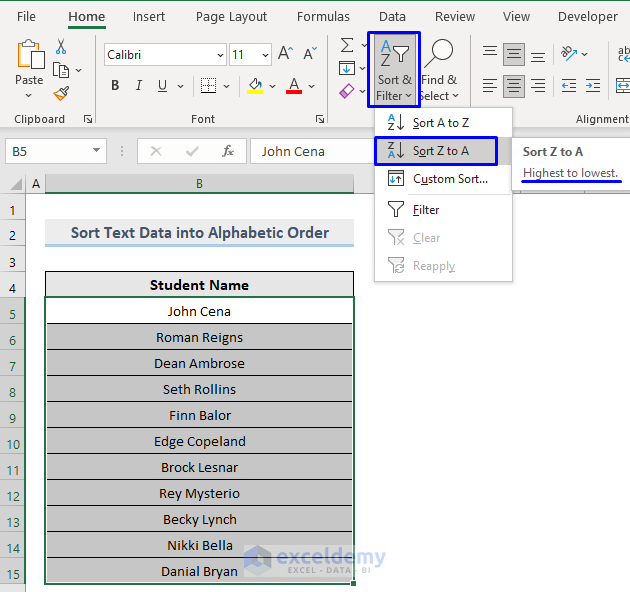
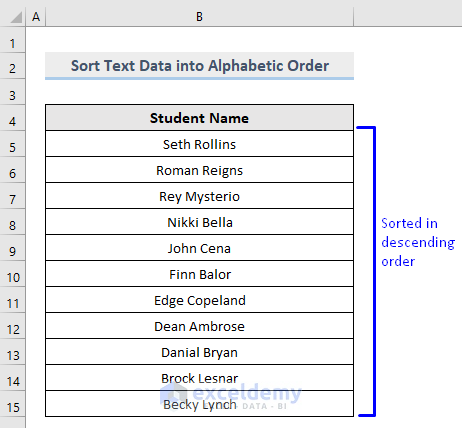
Text data will be sorted in descending order.
Read More: How to Perform Random Sort in Excel
1.2.2. Sort Numeric Data in Numerical Order
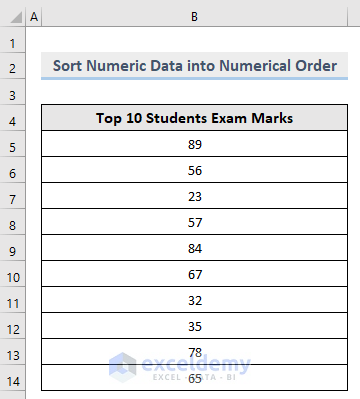
Consider the following dataset. In Column B, there are random Numbers.
1.2.2.1. Sort Numeric Data from Smallest to Largest
Steps:
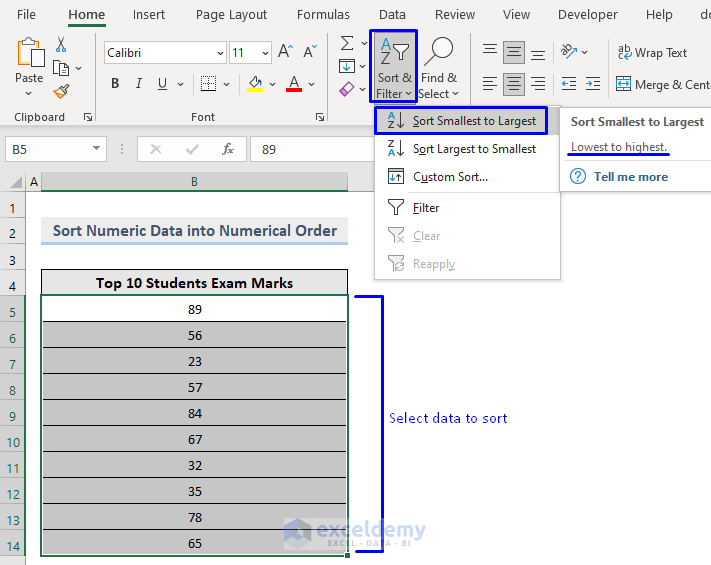
- Select the data to sort.
- In the Home tab, select Sort & Filter -> Sort Smallest to Largest in Editing.
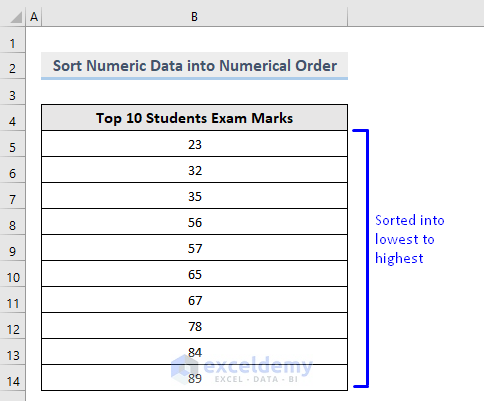
Numeric data will be sorted from smallest to largest.
1.2.2.2. Sort Numeric Data from Largest to Smallest
Steps:
- Select the data to sort.
- In the Home tab, select Sort & Filter -> Sort Largest to Smallest in Editing.
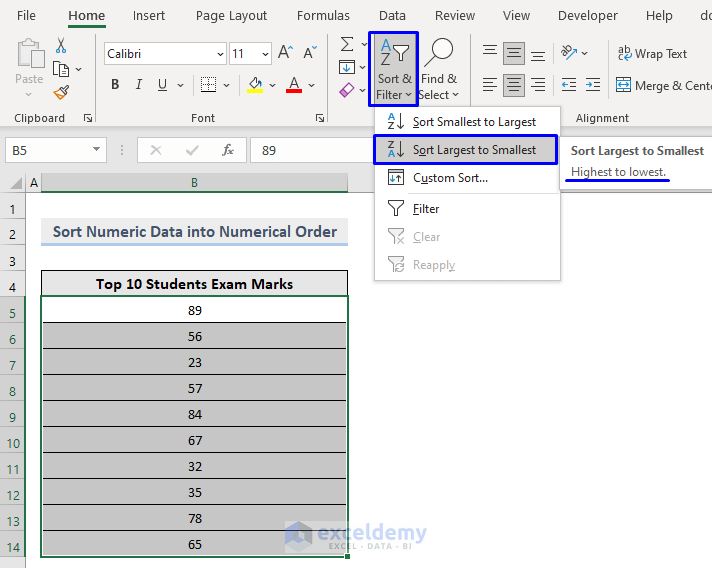
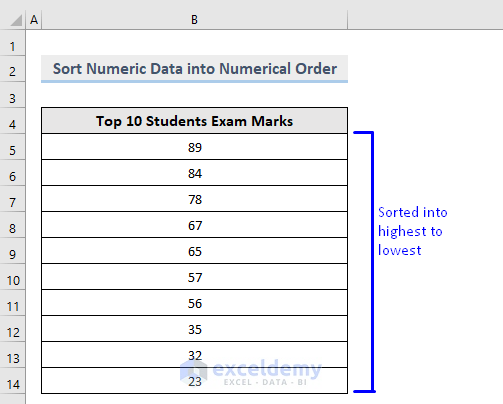
Numeric data will be sorted from largest to smallest.
Read More: How to Sort and Filter Data in Excel
1.2.3. How to Sort Text and Numeric Data
The dataset contains both text and numeric values.
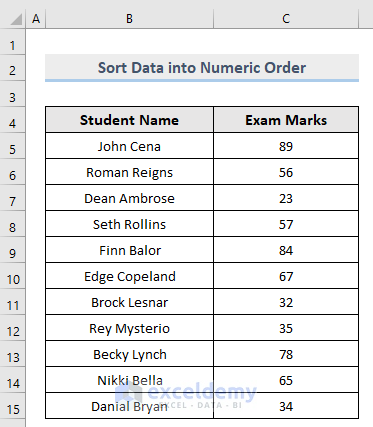
Sort the dataset based on the numeric values:
- Select the data -> Sort & Filter -> Sort Smallest to Largest/ Sort Largest to Smallest.
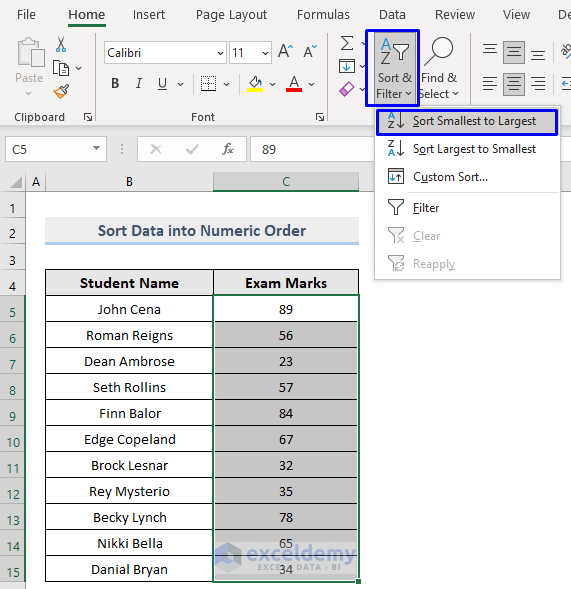
A Sort Warning message is displayed: the dataset contains Students’ Names in Column B and their Exam Marks in Column C. If you sort the Exam Marks column only and not the Students’ Names column, Students will be assigned with wrong Exam Marks.
- To sort the whole dataset based on numeric values only, check Expand the selection.
- Click Sort.
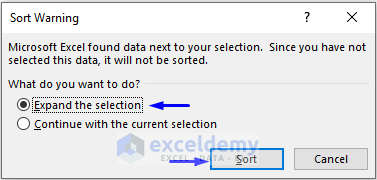
Excel will sort the whole dataset based on numeric values.
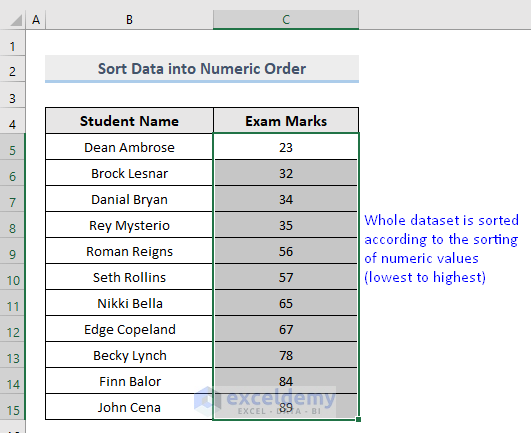
Exam Marks are sorted from smallest to largest and the order in the Students Name column is automatically modified.
- To sort the selected region only, check Continue with the current selection.
- Click Sort.
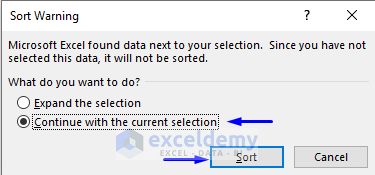
Excel will sort the selected column only based on numeric values.
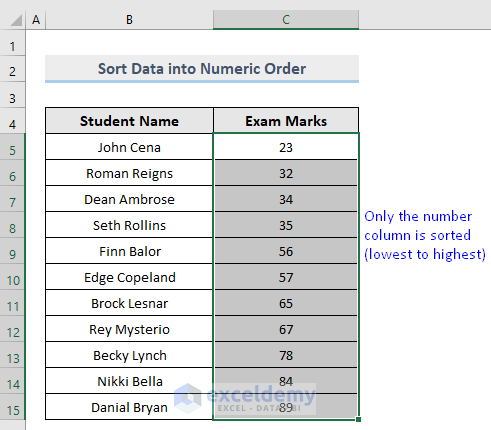
In the image above, only Column C, the Exam Marks column, is sorted.
1.2.4. Custom Sort: Sort Data by Cell Color
The dataset has background color.
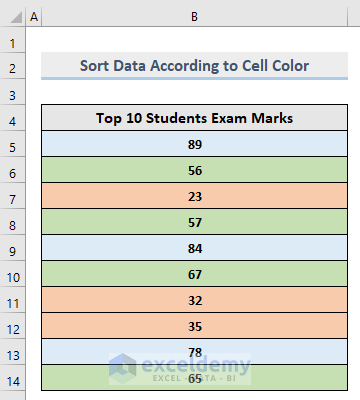
Steps:
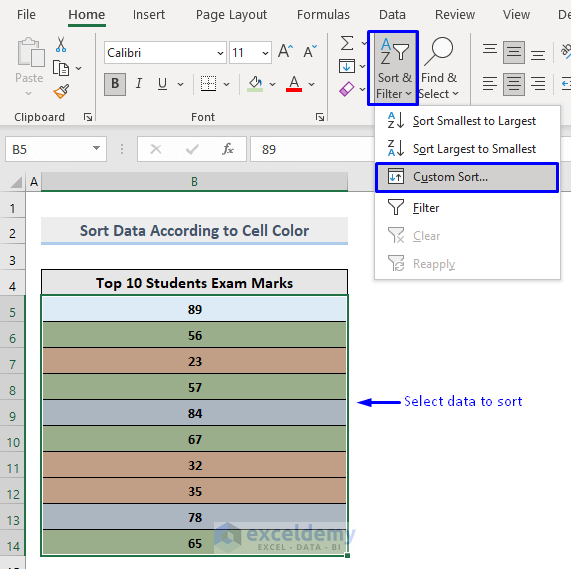
- Select the data to sort.
- In the Home tab, select Sort & Filter -> Custom Sort… in Editing.
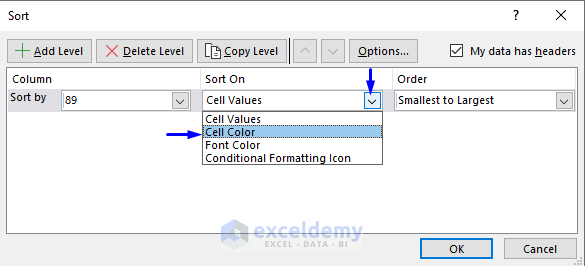
- In the Sort window, select Cell Color in Sort On.
- Click Order to see the colors in your dataset.
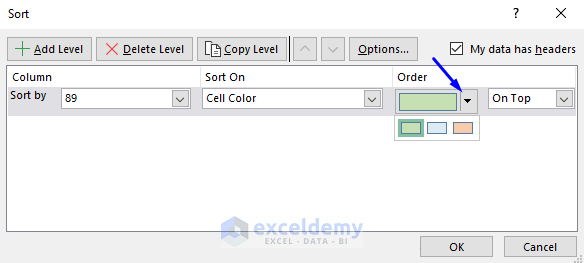
- Here, Blue was selected to stay On Top.
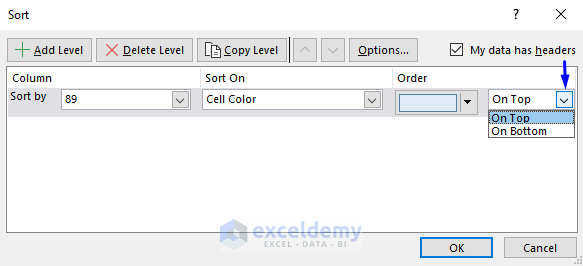
- Check My data has headers.
- Click OK.

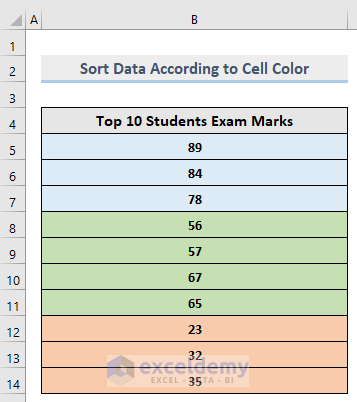
This is the output.
Read More: How to Perform Custom Sort in Excel
1.2.5. Custom Sort: Sort Data by Font Color
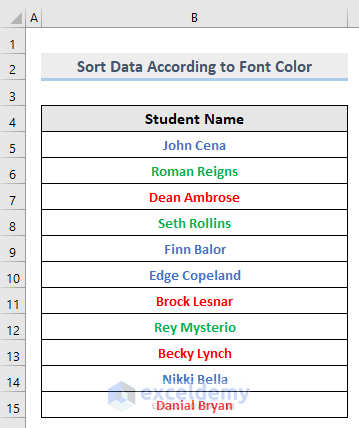
Steps:
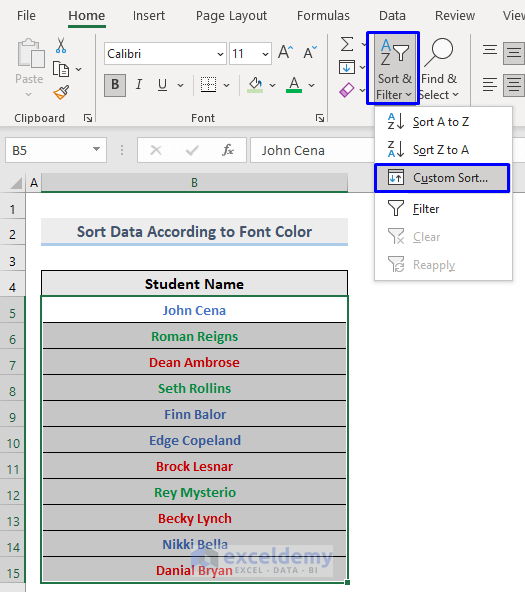
- Select the data to sort.
- In the Home tab, select Sort & Filter -> Custom Sort… in Editing.
- In the Sort window:
- Select Font Color in Sort On.
- In Order, select On Top.
- Check My data has headers.
- Click OK.
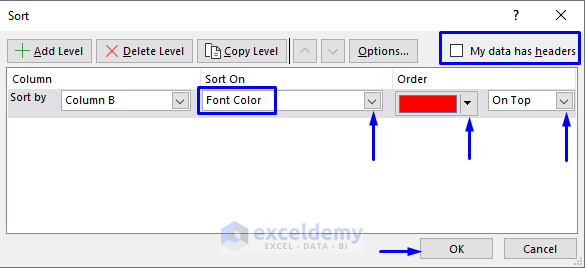
This is the output.
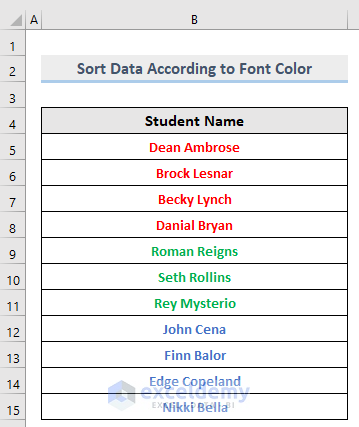
The dataset is sorted according to Font Color.
Read More: How to Do Advanced Sorting in Excel
1.2.6. Custom Sort: Sort Data using Conditional Formatting
Sort this dataset based on the icons.
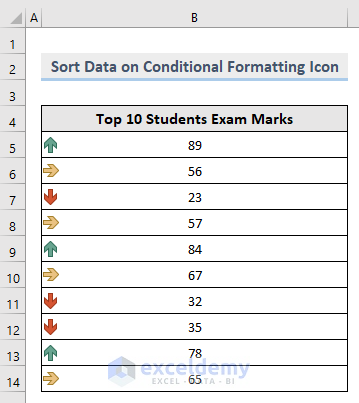
Steps:
- Select the data to sort.
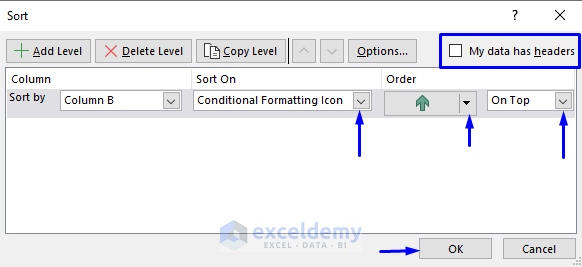
- In the Home tab, select Sort & Filter -> Custom Sort… in Editing.
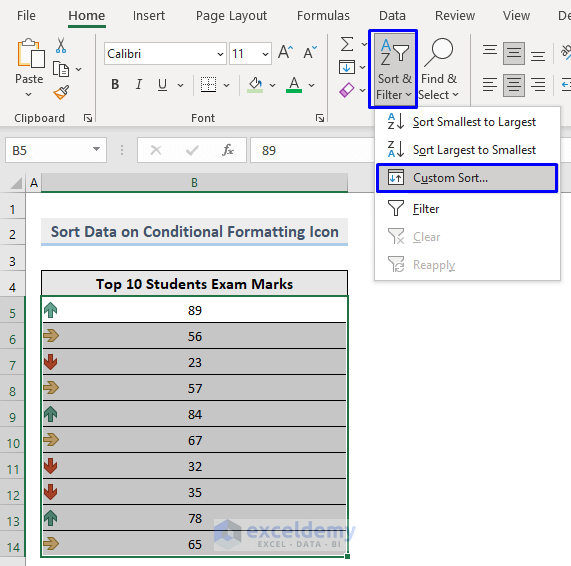
- In the Sort window:
- Select Conditional Formatting in Sort On.
- Select the order of the Icon in Order.
- Select On Top.
- Check My data has headers.
- Click OK.
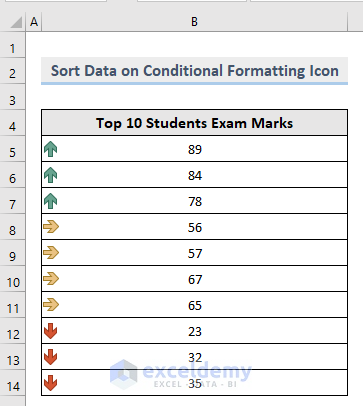
This is the output.
2. Filtering in Excel
Filtering is the process of selecting only a part of the data based on conditions. The whole dataset is kept, but only the selected part is displayed.
2.1. Filtering Methods in Excel
Microsoft Excel offers two filtering methods:
- AutoFilter
- Advanced Filter
2.2. How to Filter data in Excel
2.2.1. AutoFilter in Excel
Use the AutoFilter.
2.2.1.1. AutoFilter Text Data
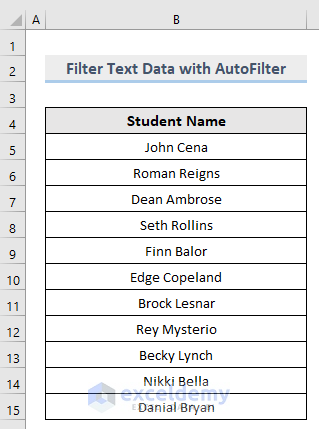
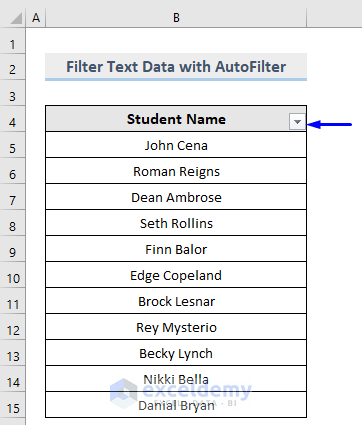
Consider the following dataset. To display specific students’ names:
Steps:
- Select any cell in the dataset.
- In the Home tab, select Sort & Filter -> Filter in Editing.
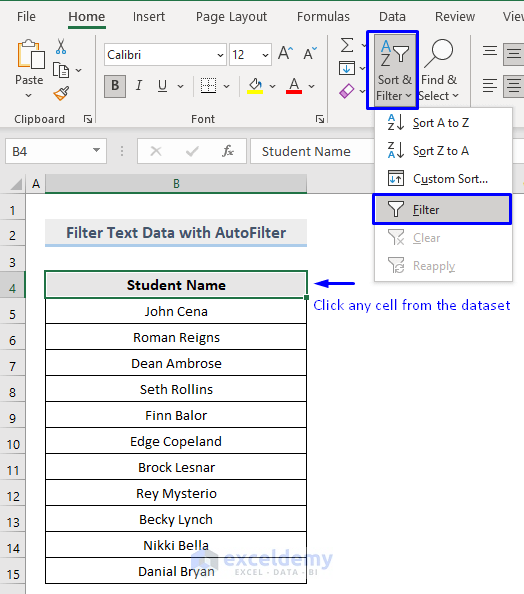
A drop-down arrow is displayed in the header cell.
- Click the drop-down arrow to see the list of options.
- Uncheck the names you want to filter.
- Click OK.
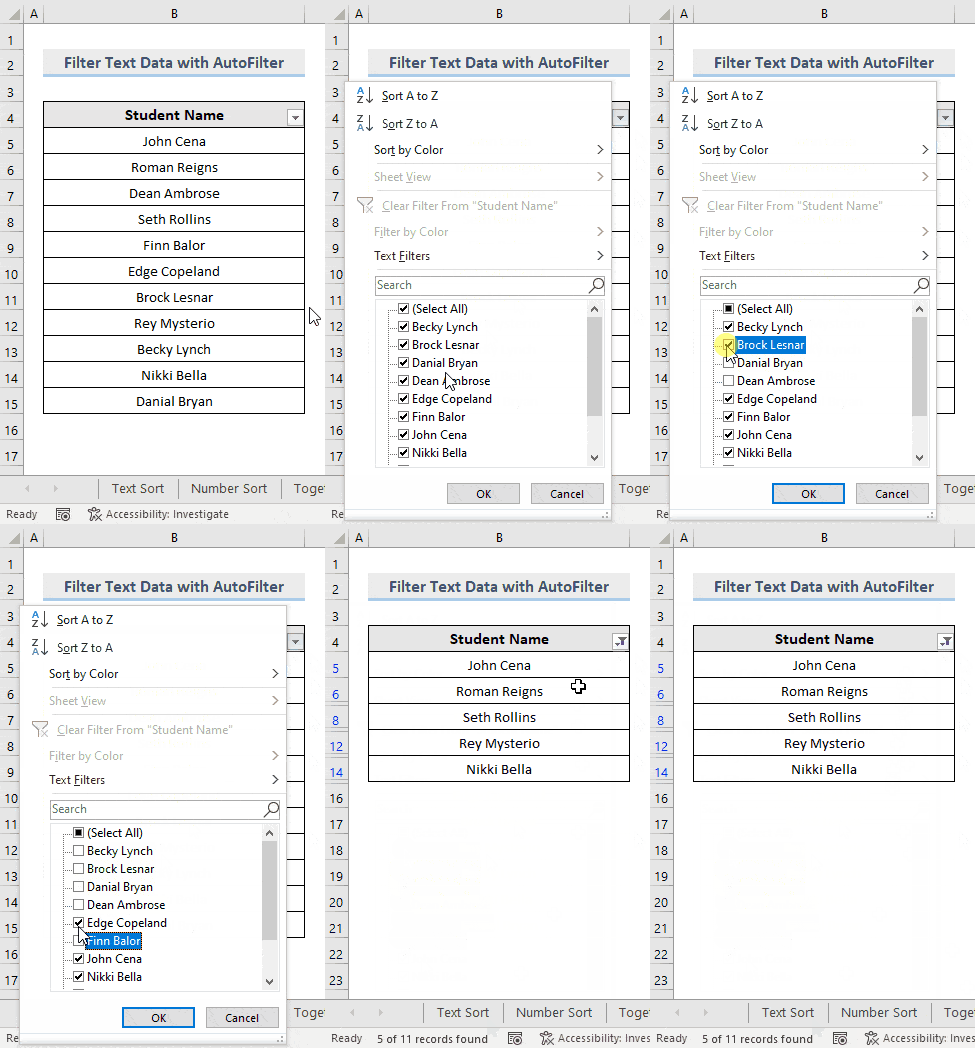
This is the output.
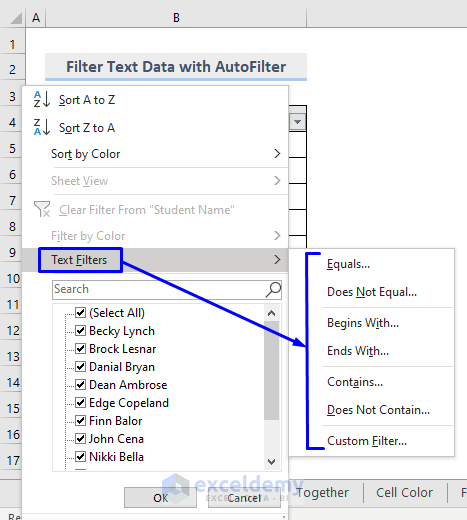
You can also use the Text Filter option:
- Click the drop-down arrow in the header to see the list of options.
- Click Text Filter. Choose a filtering option.
To extract names that start with B.
- Choose Begins With…
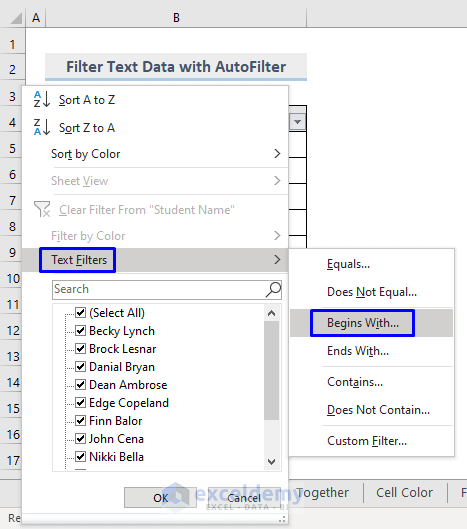
- In the Custom AutoFilter box, enter B in begins with.
- Click OK.

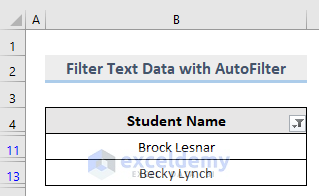
This is the output.
2.2.1.2. AutoFilter Numeric Data
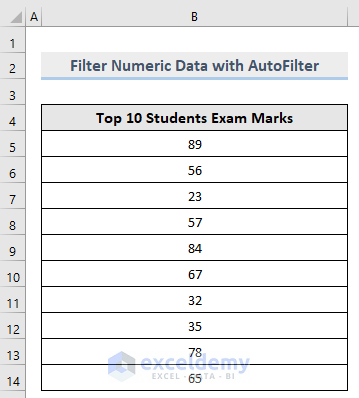
Steps:
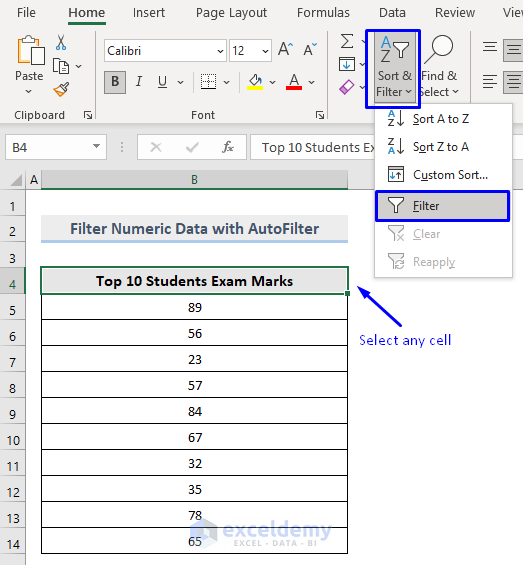
- Select any cell in the dataset.
- In the Home tab, select Sort & Filter -> Filter in Editing.
A drop-down arrow is displayed in the header cell.
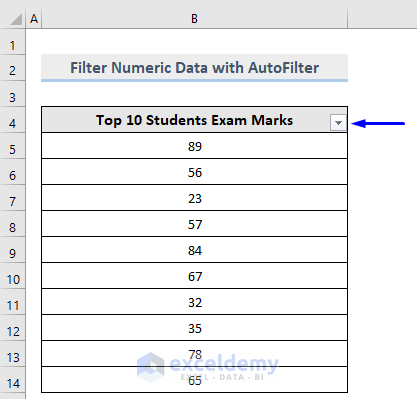
- Click the drop-down arrow to see the list of options.
- Uncheck the numbers you want to filter.
- Click OK.
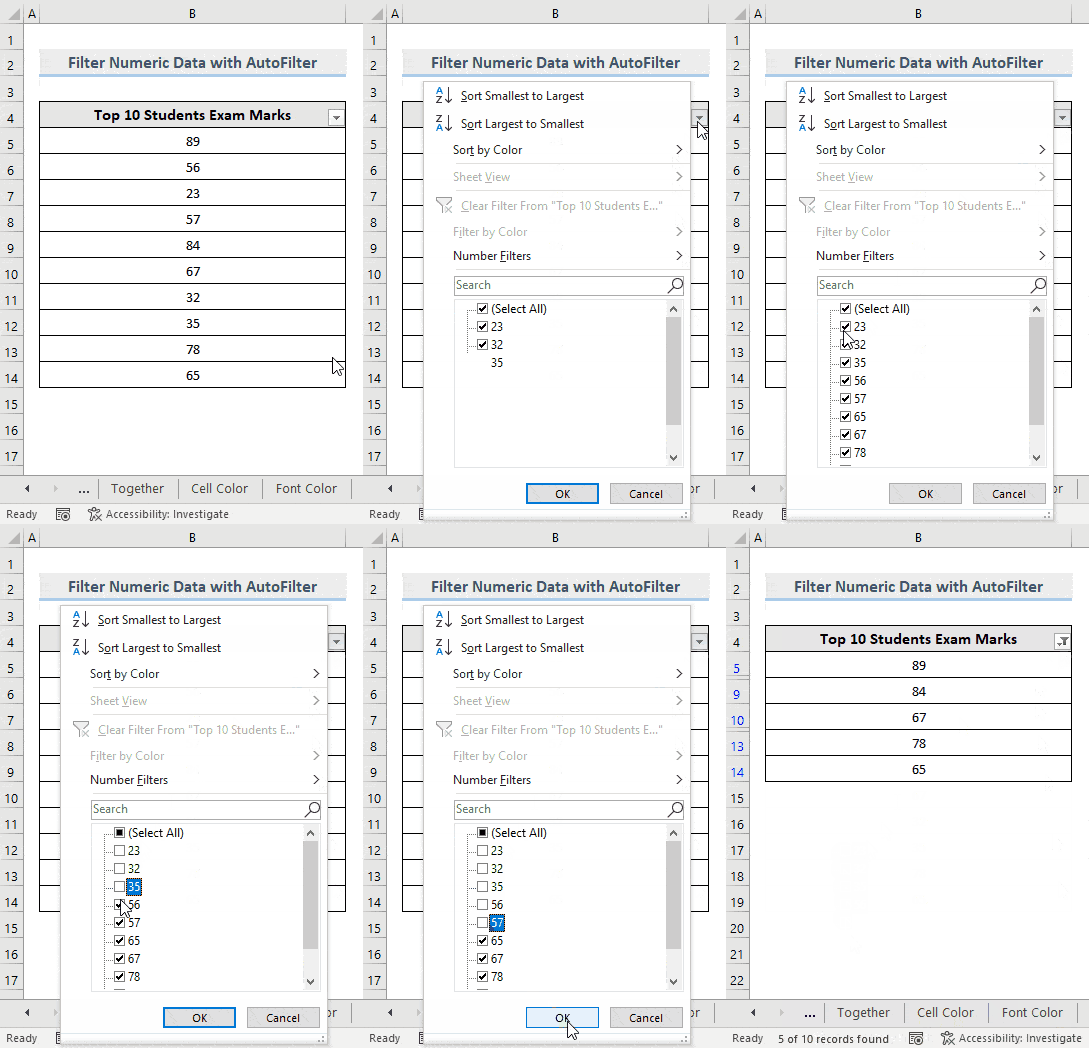
This is the output.
You can also choose Number Filter:
- Click the drop-down arrow in the header to see the list of options.
- Click Number Filter. Choose a filtering option.
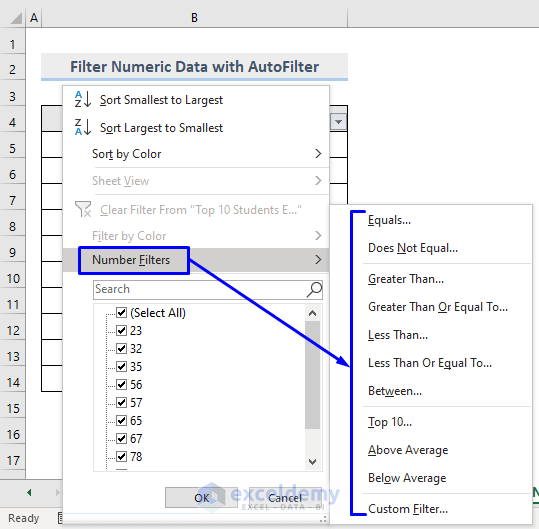
- To extract numbers between 50 and 80.
- Choose Between…
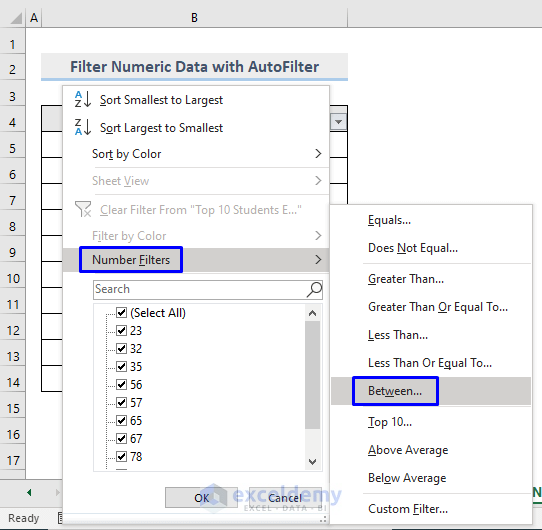
- In the Custom AutoFilter box, enter 50 in is greater than or equal to the field, write 50. You can also select the numbers from the drop-down arrow.
- Enter 80 in is less than or equal to.You can also select the numbers from the drop-down arrow.
- Click OK.

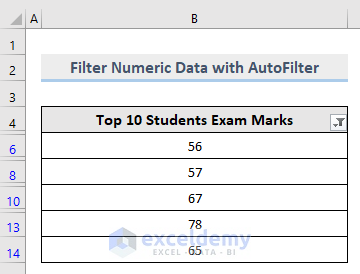
This is the output.
2.2.2. Using an Advanced Filter in Excel
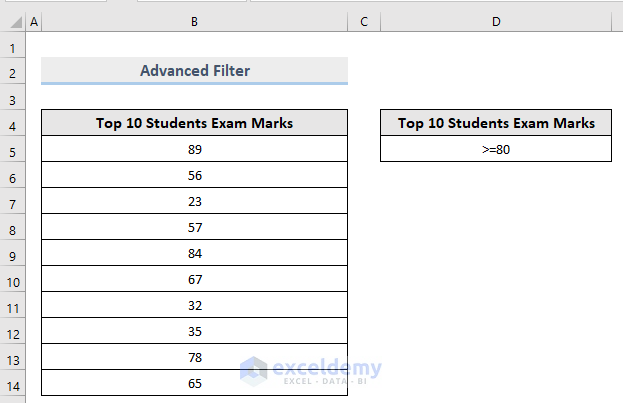
Before using an Advanced Filter, store the condition on a separate range based on which you want to filter data.
To extract the numbers greater than or equal to 80, enter (>=80) in D5.
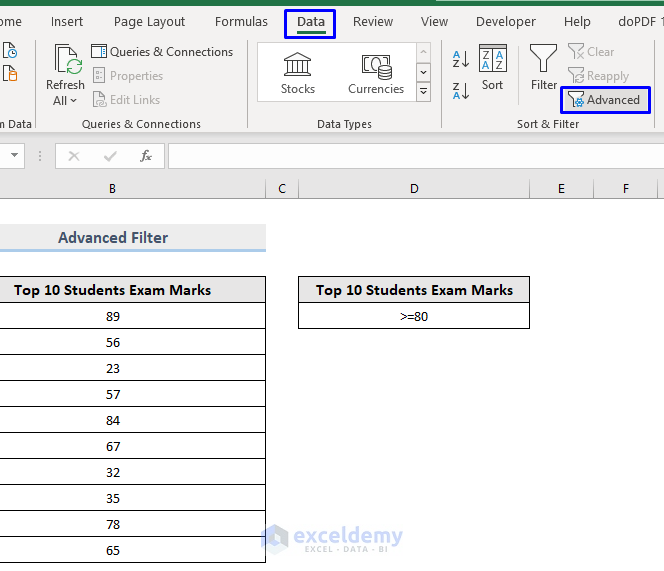
- Go to the Data tab.
- Select Advanced in Sort & Filter.
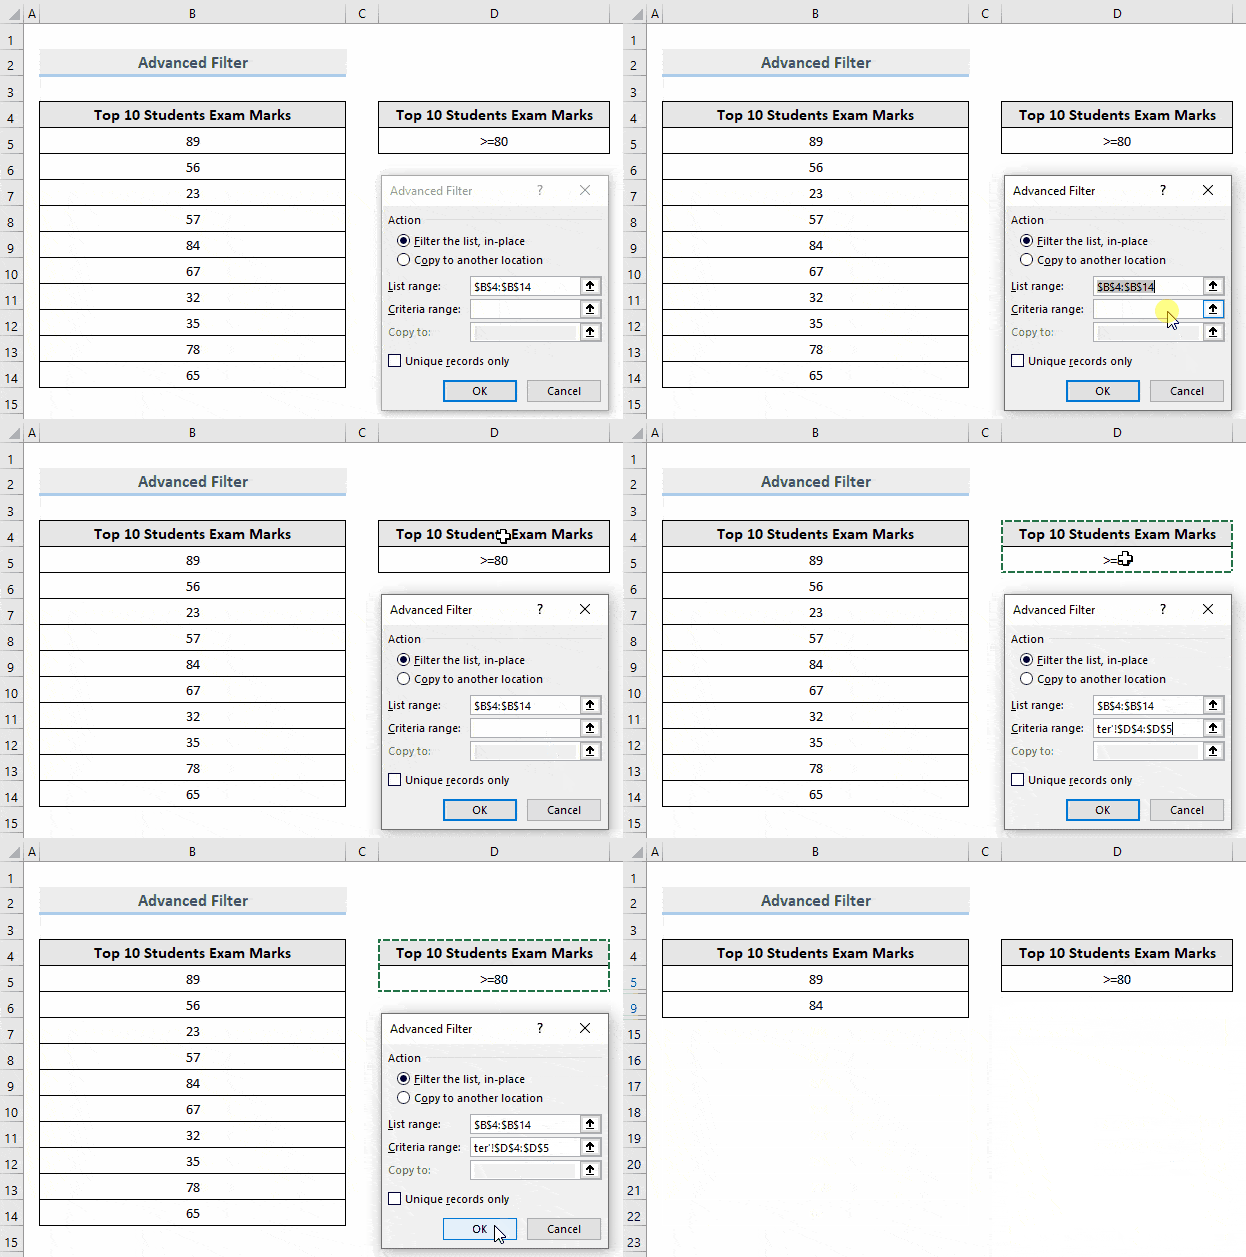
- In Advanced Filter, select Filter the list, in-place.
- The List range field will be automatically detected by Excel. If it isn’t, select it manually.
- In Criteria range, drag the criteria range stored in the dataset. Here, D4:D5.
- Click OK.
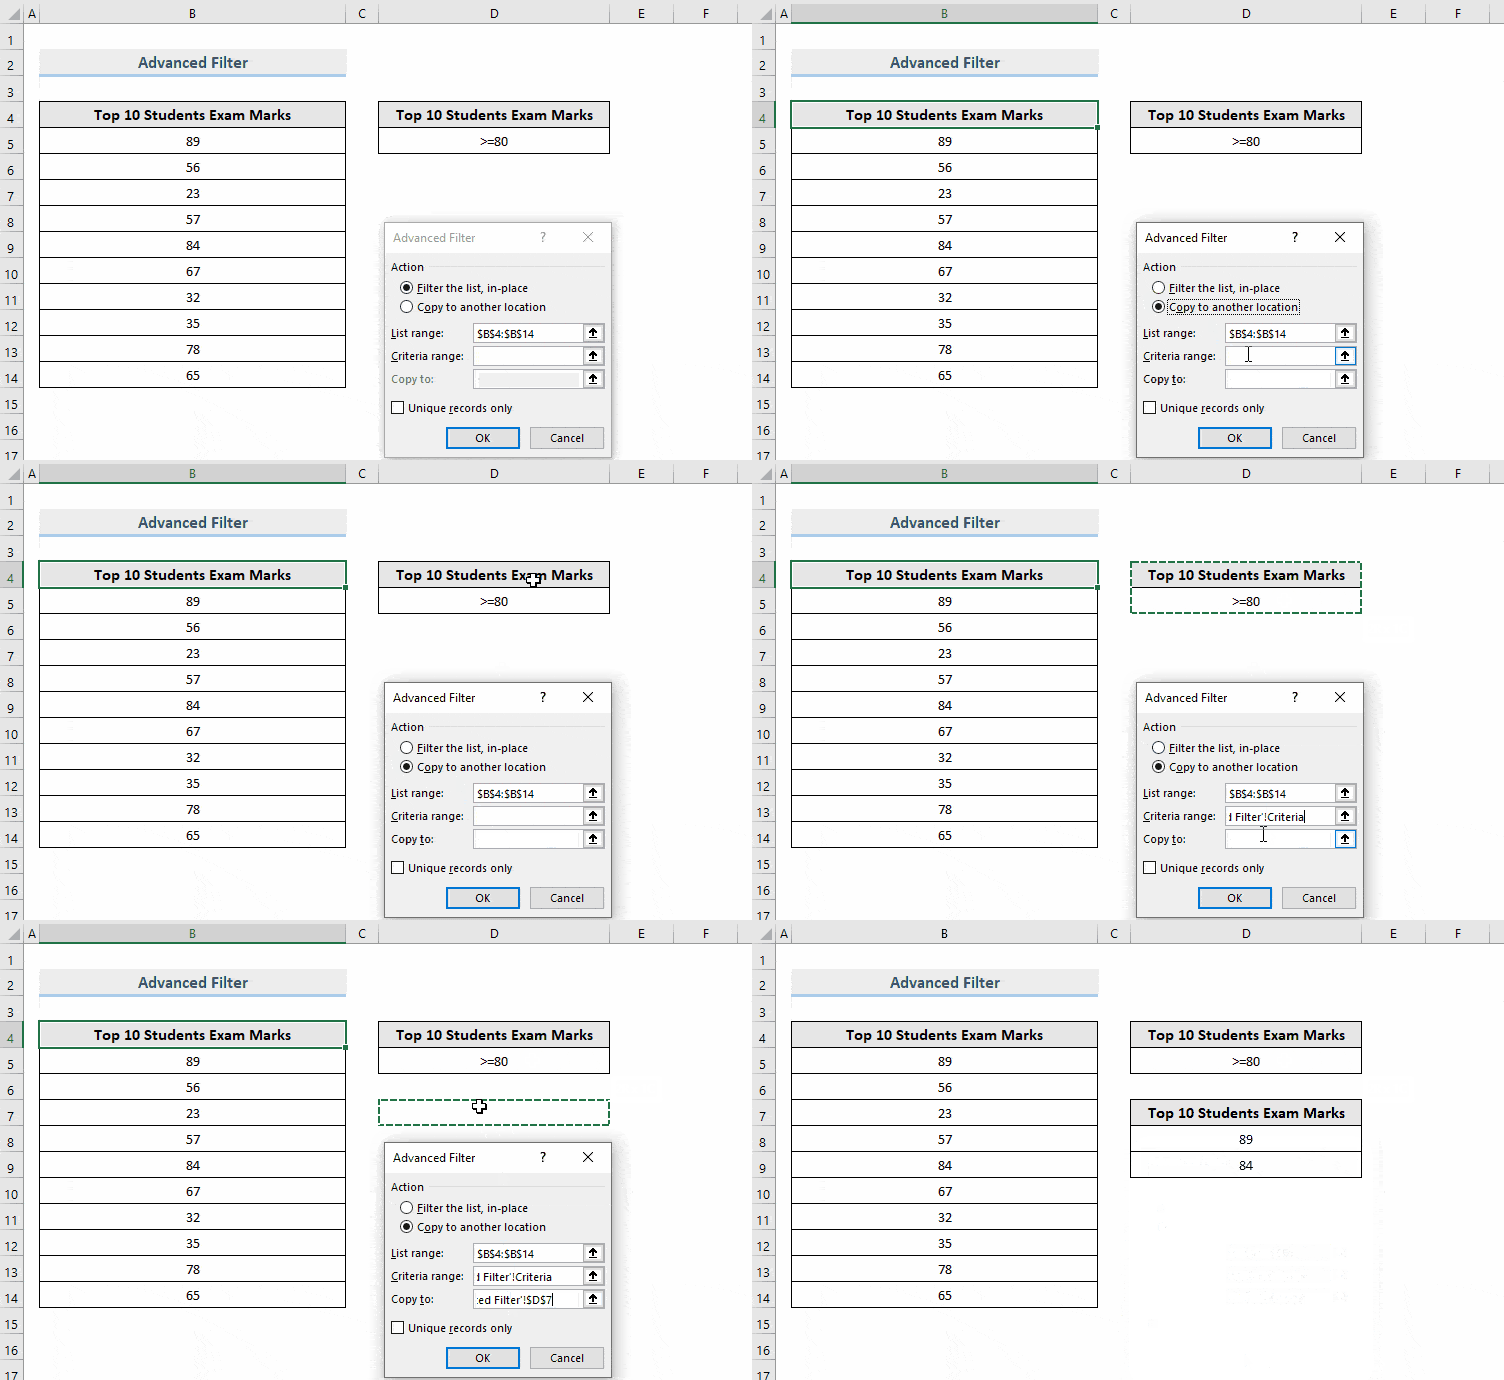
- To place the filtered data in a different location, check Copy to another location.
- Enter List range and Criteria range.
- In Copy to, select a range to export the filtered data. Here, D7.
- Click OK.
2.3. Clearing the Filter
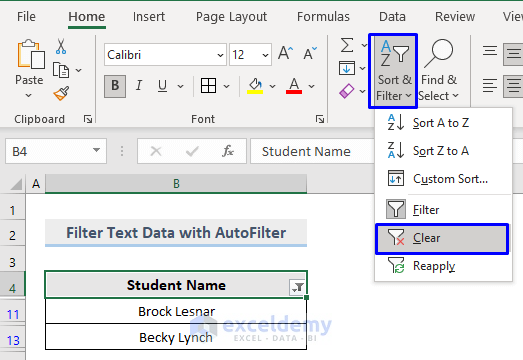
To clear any filter from the dataset, select Sort & Filter -> Clear in Editing in the Home tab.
Difference Between Sort and Filter in Excel
| Subject | Sort | Filter |
|---|---|---|
| Purpose | The process of arranging data in a particular order. | The process of selecting only a part of the data and filtering the rest based on conditions. |
| Methods | Sort text values and numeric values in ascending or descending order. Sort based on Cell Color, Font Color, and Conditional Formatting Icons. | Filter data using AutoFilter and Advanced Filter. |
| Use |
|
|
| Advantages |
|
|
| Examples |
|
Filter numbers or text in a large dataset based on a condition. |
Download Practice Workbook
Download the free practice Excel workbook.
Related Articles
- How to Sort IP Address in Excel
- How to Sort Drop Down List in Excel
- How to Sort Excel Tabs in Ascending or Descending Order
<< Go Back to Sort in Excel | Learn Excel
Get FREE Advanced Excel Exercises with Solutions!

