Issue 1 – Unable to Edit Embedded Excel Chart in PowerPoint
- Select the cell range B4:C14 as we want to create a chart out of these values.

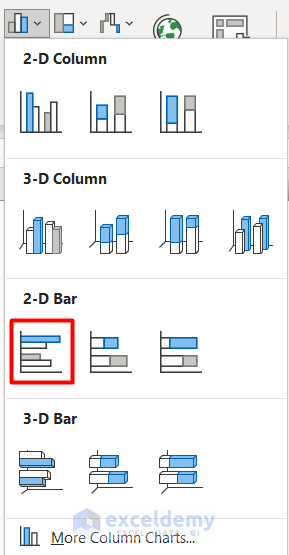
- Go to the Insert tab and click Insert Column or Bar Chart.

- Select 2D Clustered Bar.
- Select any other type of chart as well.
- Get a chart like the picture below.
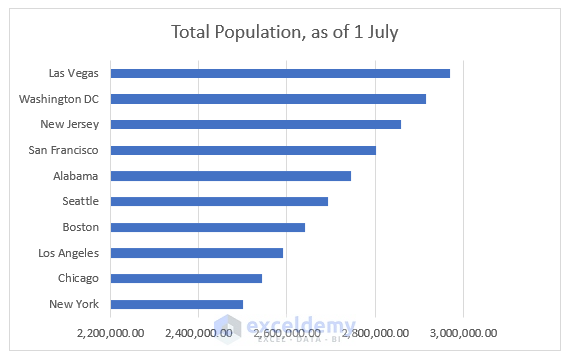
- Select the chart and press Ctrl + C to copy.
- Open the PowerPoint application and press Ctrl + V to paste it.
- Click on the Filter icon beside the chart in PowerPoint.
- Deselect Los Angeles and Boston categories.
- Click Apply.
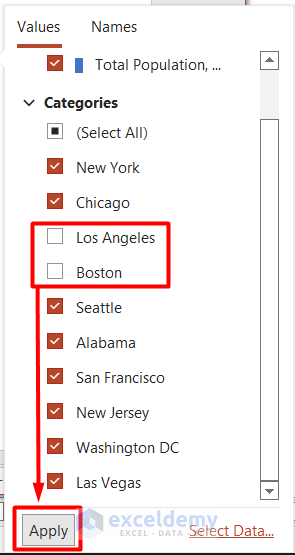
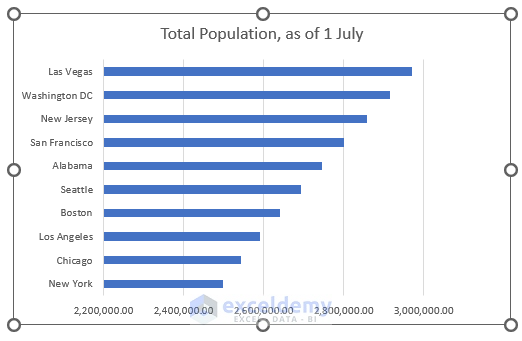
- You were supposed to get a filtered chart, but you will see that despite deselecting two categories, the chart values did not change at all.
Solution 1 – Update Microsoft Excel
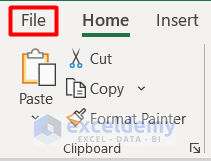
- Go to the File tab in your Excel workbook.
- Click on Account in the Backstage View.

- Select Update Now from the Update Options.
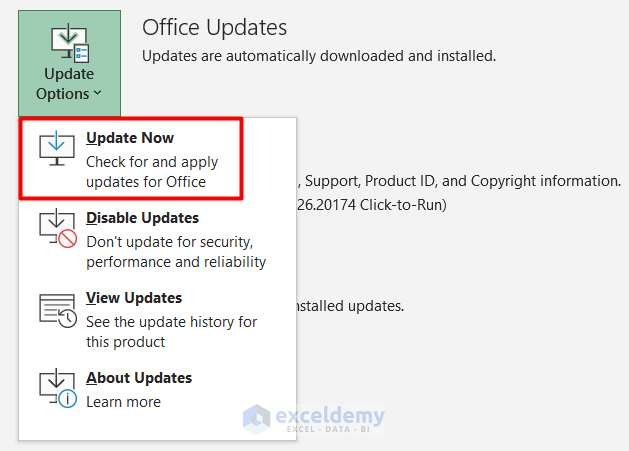
- If your Microsoft Excel application needs any updates it will then show the required updates. Update the software, and the problem will be solved.
Solution 2 – Repair Office 365
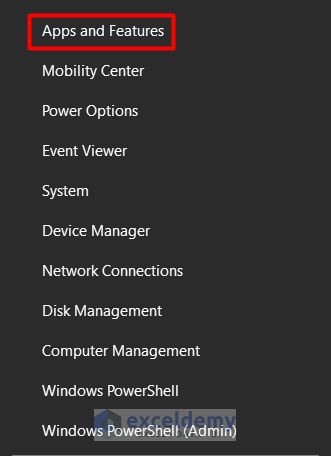
- Right-click on the Start button in your system and select Apps and Features.
- Find the office application installed on your device.
- Select it and click on Modify.

- Follow the instructions to Repair your software and it will result in solving the issue.
Issue 2 – Large Embedded Picture in PowerPoint
- Select the whole dataset in your workbook.
- Right–click on it and click Copy.

- Go to the blank slide in PowerPoint.
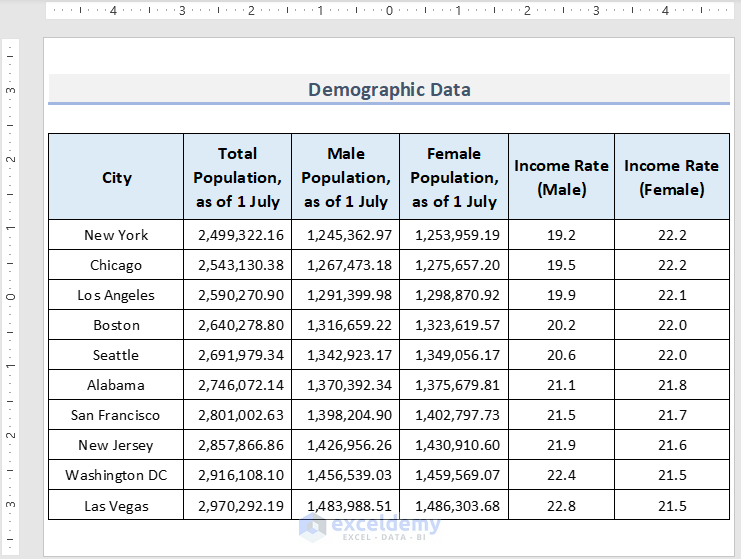
- Right-click on it and click Picture as the Paste Options.
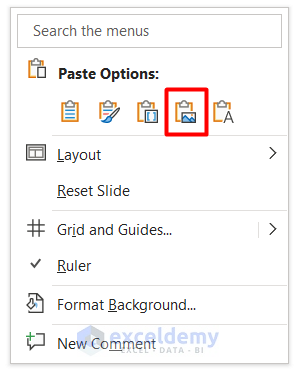
- We got the dataset as an image, but the file size increased.
Solution – Compress the Embedded Picture
- Select the picture in PowerPoint.
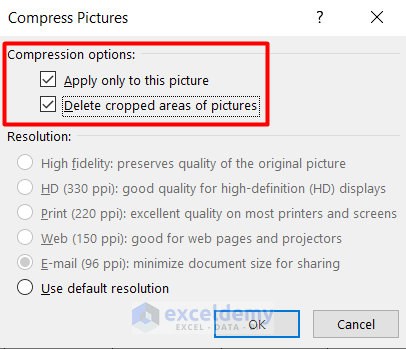
- Go to the Picture Format tab and select Compress Pictures.

- Select the Compression options in the Compress Pictures window, as shown below.
- Select Use default resolution and press OK.
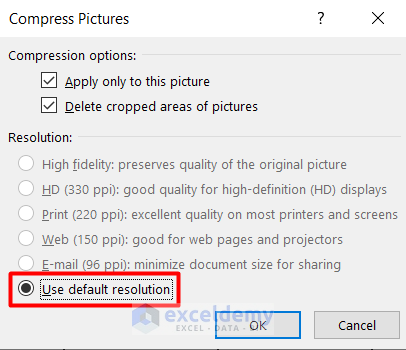
- The file size will reduce keeping the quality of graphics as before.
Issue 3 – Exposed Excel Data After Embedding in PowerPoint
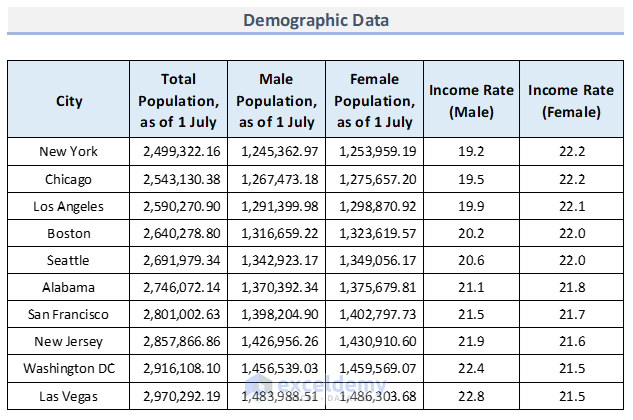
- Select the dataset in the cell range B4:G14.
- Press Ctrl + C to copy it.
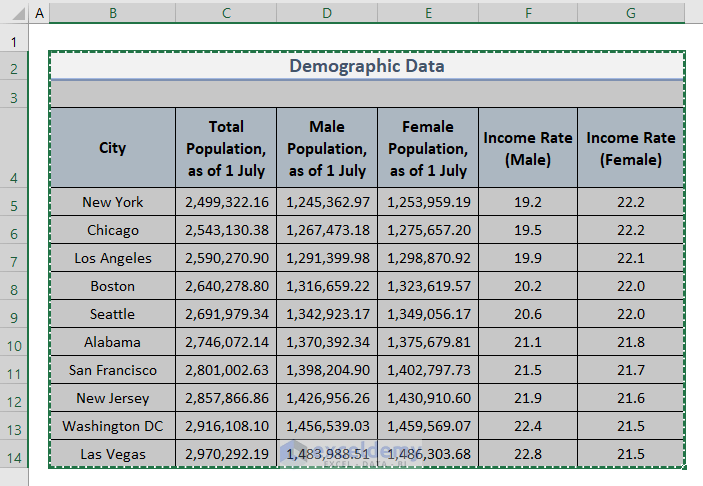
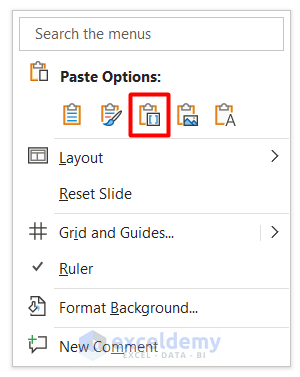
- Open a PowerPoint slide and right-click on it.
- Click on Embed from the Paste Options.
- Get the dataset on the slide.
- When you double-click on it, you will get the original Excel file in an editable format.
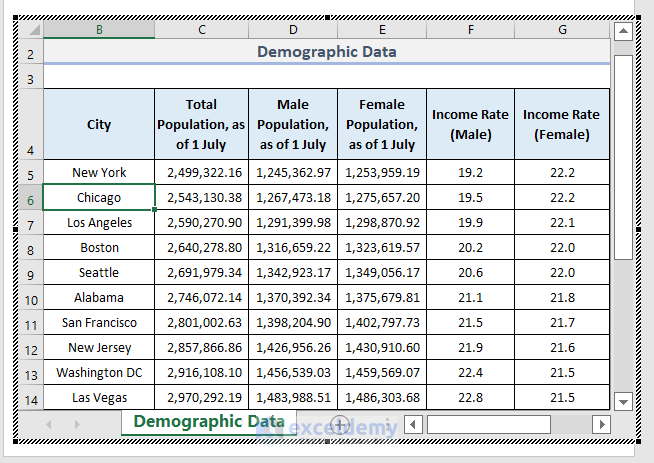
This feature is risky mainly when the file contains any information irrelevant to the presentation.
Solution – Change Embedding Path
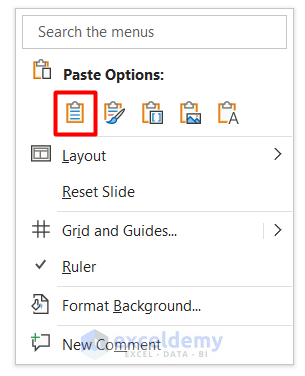
- While pasting the dataset, select Use Destination Styles in Paste Options.
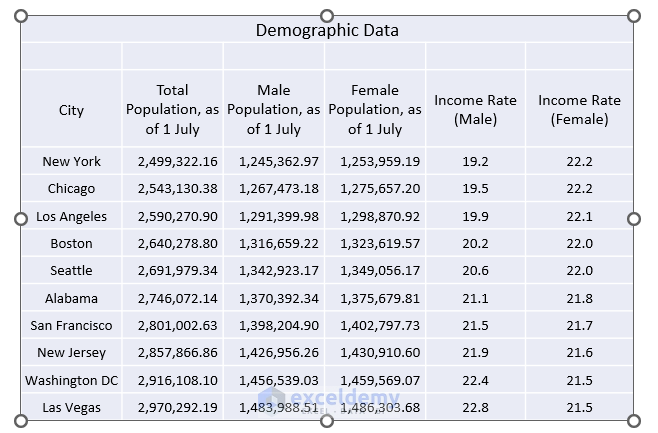
- You will get the dataset as a table which is not editable as before.
Issue 4 – Cut Off in Embedded Excel Data in PowerPoint
When we embed the Excel file in PowerPoint, we often face the cut-off in the table like this.
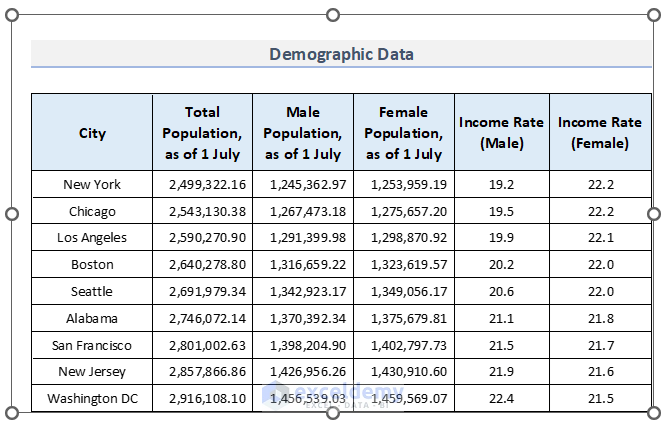
The last row of values is missing in the dataset.
Solution – Insert Excel File as Object
- Open a blank slide in PowerPoint.
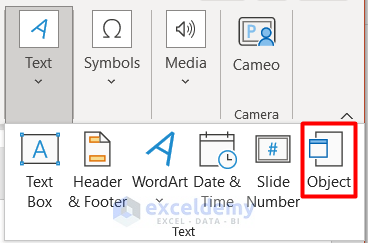
- Go to the Insert tab and click on the Text icon.

- Select Object from the drop-down menu.
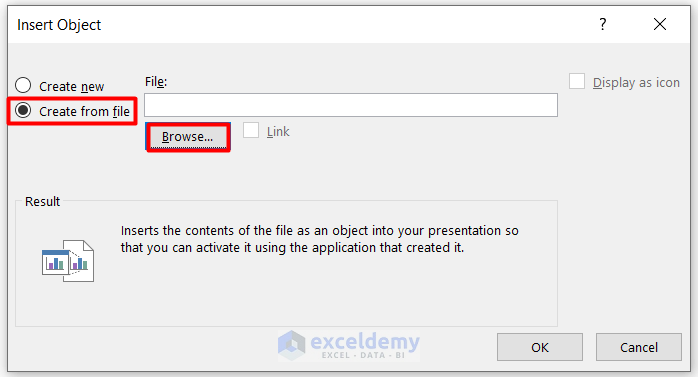
- Select Create from file in the Insert Object dialogue box.
- Click on Browse to locate the destination of the Excel file.
- See the name of the Excel file in the File box.
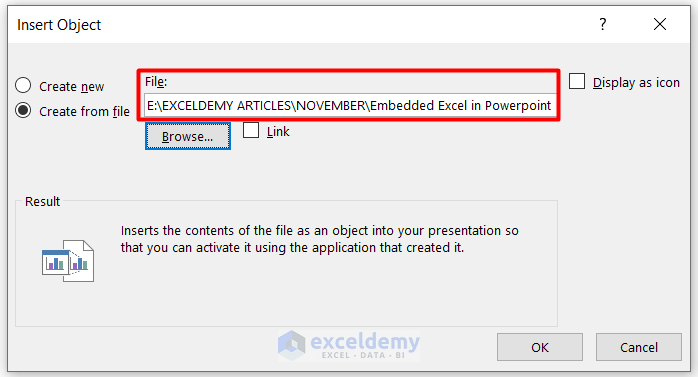
- Press OK, and you will get the total dataset without any cut-off.
Advantages and Disadvantages of Embedding Excel Files
Advantage:
- The embedded file is attached to the PowerPoint file. Changes are possible within the presentation file.
Disadvantages:
- The file size gets bigger.
- Any mismatch may happen between the PPT file and the Excel file, as the dataset is editable inside the presentation.
Download the Practice Workbook
Related Articles
- How to Open Existing PowerPoint File from Excel VBA
- [Solved] Embedded Excel in PowerPoint Not Showing All Data
<< Go Back to Excel to PowerPoint | Export Data from Excel | Learn Excel
Get FREE Advanced Excel Exercises with Solutions!

