Method 1 – Add a New Column to the Existing Dataset
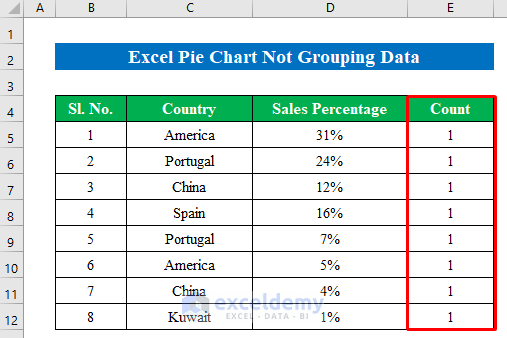
- Start by entering a new column just by the side of the data table.
- Fill them with “1” to get the duplicates counted.
Method 2 – Create a Pivot Table from Dataset
- Create a pivot table from the “Insert” option.
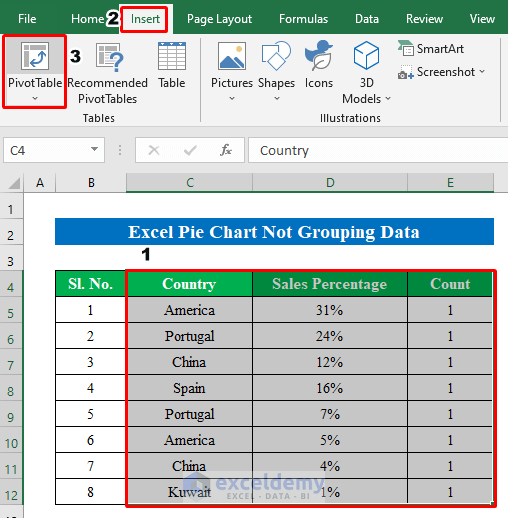
- A new window named “PivotTable from table or range” will pop up.
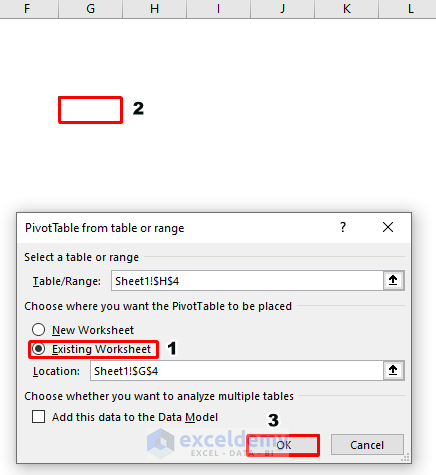
- From the new window choose “Existing worksheet” and select a location from the worksheet where you want to make your pivot table.
- Press OK to continue.
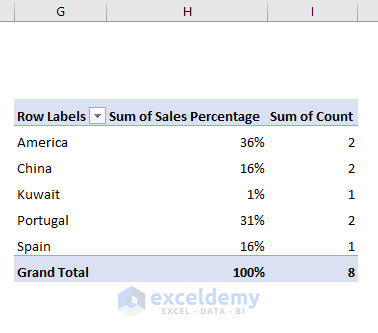
- From the right pane, check mark all three options in the “Pivot Table Fields”.

- Here we have created our pivot table by grouping all the data.
Method 3 – Group Data in Pie Chart Using Recommended Charts Option
- Choose data from the pivot table and go to “Recommended Charts” from the “Insert” option which will solve the Excel pie chart not grouping data.
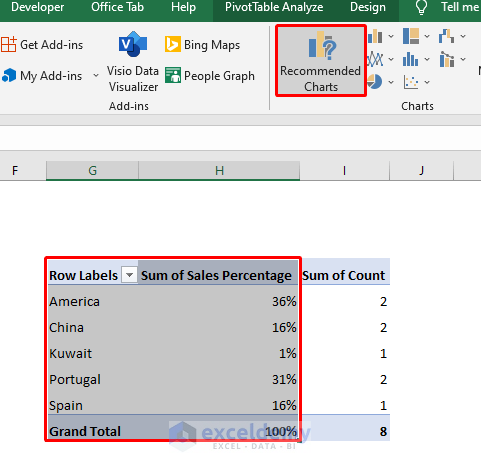
- From the new window of “Insert Chart” click “Pie” and press OK.
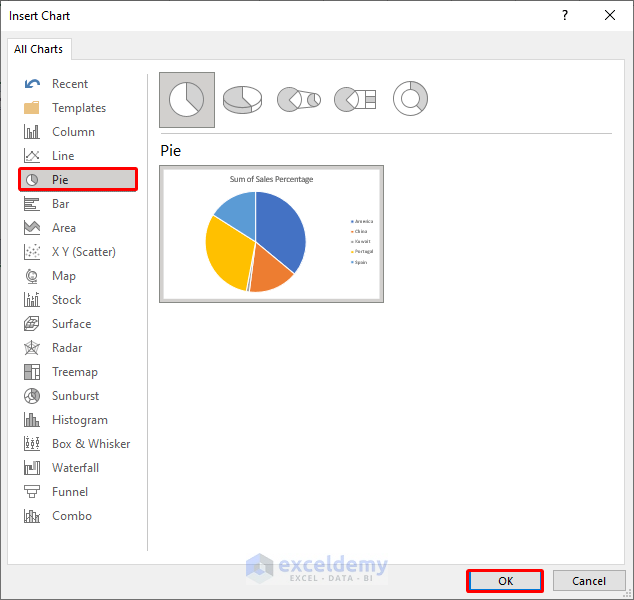
- We created our pie chart by grouping all the data in Excel.

Things to Remember
- You can group data by directly inserting a pivot table in the worksheet if you want. Here in the first step, I have added a new column to make a better understanding of the duplicates.
Download Practice Workbook
Related Articles
- How to Show Percentage in Excel Pie Chart
- How to Show Percentage and Value in Excel Pie Chart
- How to Show Percentage in Legend in Excel Pie Chart
- How to Show Total in Excel Pie Chart
- How to Create Pie Chart for Sum by Category in Excel
<< Go Back To Excel Pie Chart | Excel Charts | Learn Excel
Get FREE Advanced Excel Exercises with Solutions!


That is silly that Excel has to make you do a pivot table in order to consolidate data for a chart. Makes no sense.
Dear Brenda,
Thank you for your comment.
In order to create a pie chart you don’t need to create a pivot table. But if your data have duplicate values then you must create a table to group those data and then create a pie chart. Otherwise the duplicate value will not group together. Because there’s no direct command or pivot pie chart in Excel to group data.
There’s Pivot chart feature by which you can group data from pivot table fields and that is a column chart not pie chart. That’s why you need to create a table first and then create the pie chart.
We’ll really appreciate your response If you have any alternative solution and share with us.
Thanks & Regards
Wasim Akram
Team Exceldemy