Method 1 – Find T Critical Value in Excel
The T critical value is basically the indicator of determining the statistical significance of a T-test. Depending on the type of test, the calculation process varies.
1.1 Use T.INV Function for Left-Tailed Test
Steps:
- Go to C8. Write down the following formula.
=T.INV(C4,C5)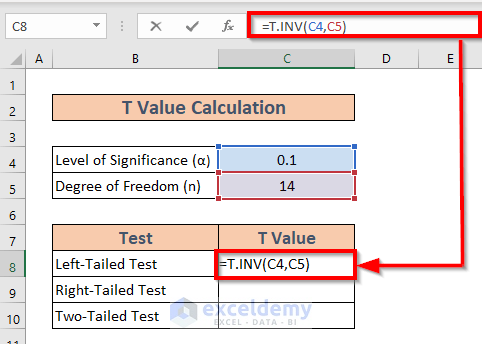
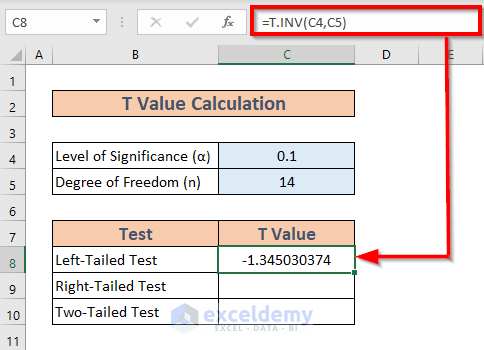
- Press ENTER. Excel will return the result.
1.2 Combine ABS and T.INV Functions for Right-Tailed Test
Calculate the T critical value for a right-tailed test. This time I will use the ABS function along with the T.INV function.
Steps:
- Go to C9. Write down the following formula.
=ABS(T.INV(C4,C5))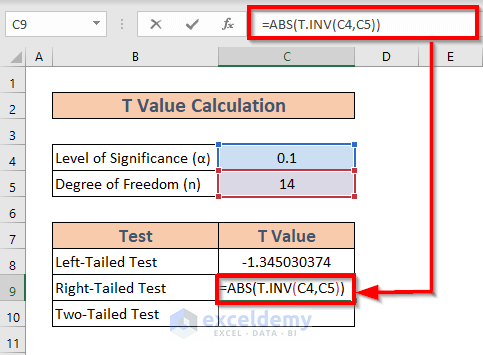
Explanation:
The T.INV(C4,C5) returns the T-value for the left-tailed test and the ABS function adjusts the result for a right-tailed one.
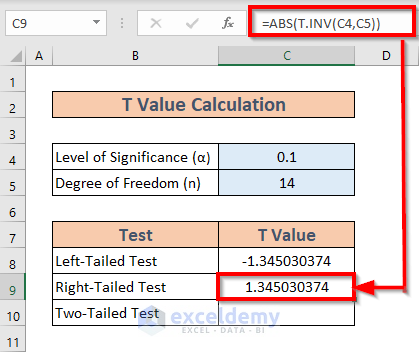
- Press ENTER. Excel will return the result.
1.3 Apply T.INV.2T Function for Two-Tailed Test
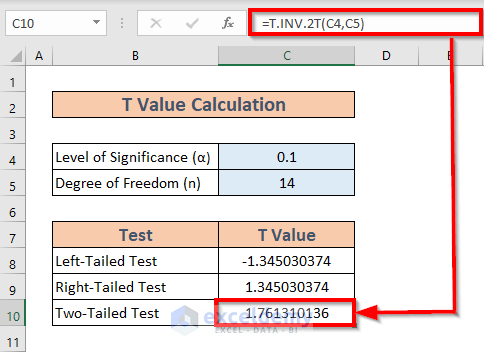
Focus on a two-tailed test. To calculate the T critical value for a two-tailed test, we ought to use the T.INV.2T function.
Steps:
- Go to C10. Write down the following formula
=T.INV.2T(C4,C5) 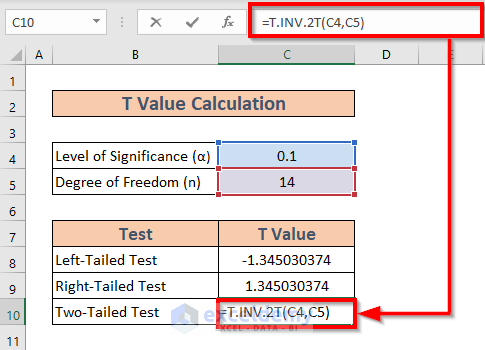
- Press ENTER. Excel will show the result.
Method 2 – Use of NORM.S.INV Function to Find Z Critical Value in Excel
Put some light on Z critical value. It is a statistical term widely used to determine the statistical significance of a hypothesis. The population parameters are of concern. We need to calculate the Z critical value for 3 different types of cases.
- Left-tailed test
- Right-tailed test
- Two-tailed test
2.1 For Left-Tailed Test
Steps:
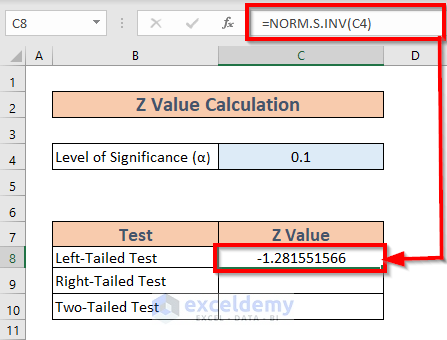
- Go to C8 and write down the following formula
=NORM.S.INV(C4) 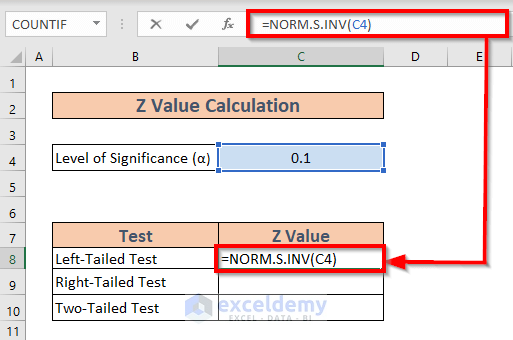
- Press ENTER. Excel will return the output.
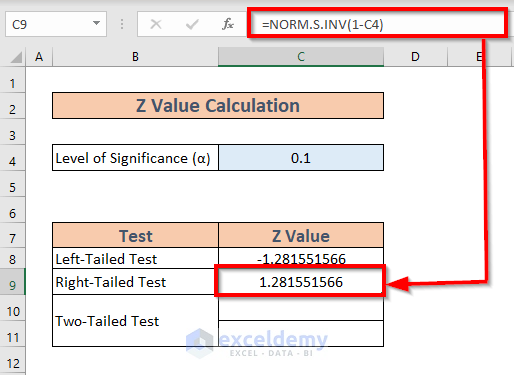
2.2 For Right-Tailed Test
Steps:
- Go to C9 and write down the following formula
=NORM.S.INV(1-C4)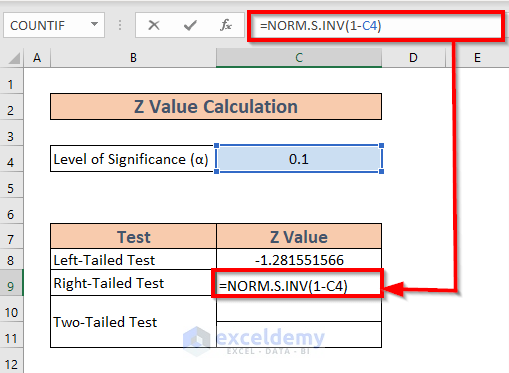
- Press ENTER. You will get the result.
2.3 For Two-Tailed Test
Steps:
- Go to C10. Write down the following formula
=NORM.S.INV(C4/2)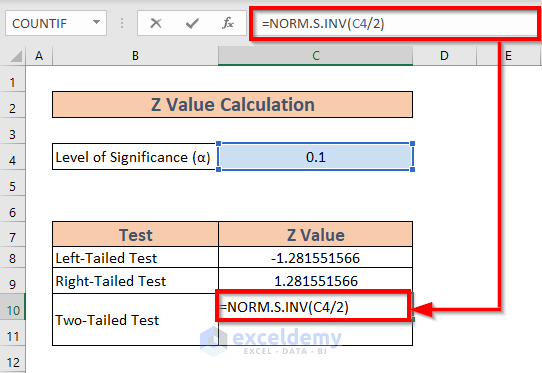
- Press ENTER to get the output.
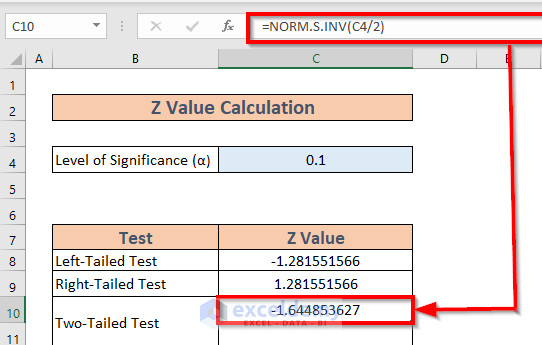
- Write down the following formula in C11.
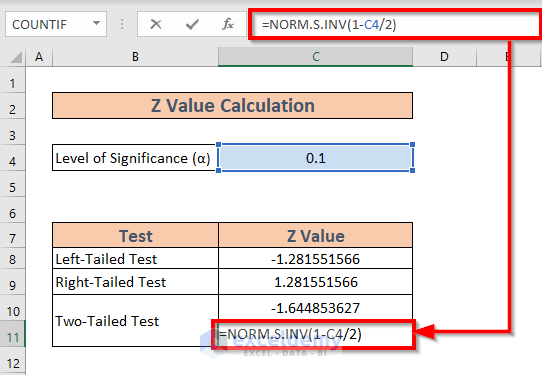
- Press ENTER to calculate the result.
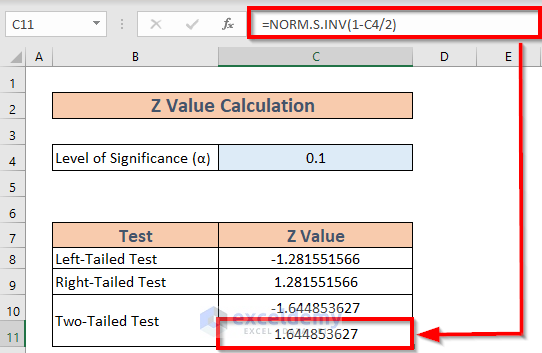
Things to Remember
- The ABS function adjusts the T value for a right-tailed test.
- The T and Z critical values differ from the T and Z values. We calculate the T and Z values from the sample statistic and population parameters. Then we compare those values with the critical values to determine the statistical significance of a hypothesis.
- T values are used when the standard deviation of the population is unknown and the sample size is relatively small.
Download Practice Workbook
Download this practice while going through this article.
Related Article
<< Go Back to Critical Value in Excel | Excel for Statistics | Learn Excel
Get FREE Advanced Excel Exercises with Solutions!

