Below is a dataset with 3 columns: “Company,” “Advertising,” and “Revenue.” We will find the relationship between advertising and revenue generation for Company XYZ. This error will tell us how much our predicted values differ from the actual values.
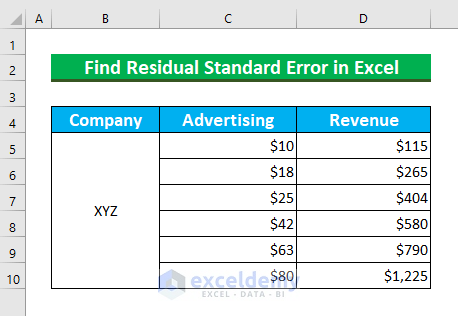
Method 1 – Using Regression Analysis to Find a Residual Standard Error
Steps:
- Press ALT, F, and O to open the Excel Options window.
- From Add-ins >>> select “Go…”.
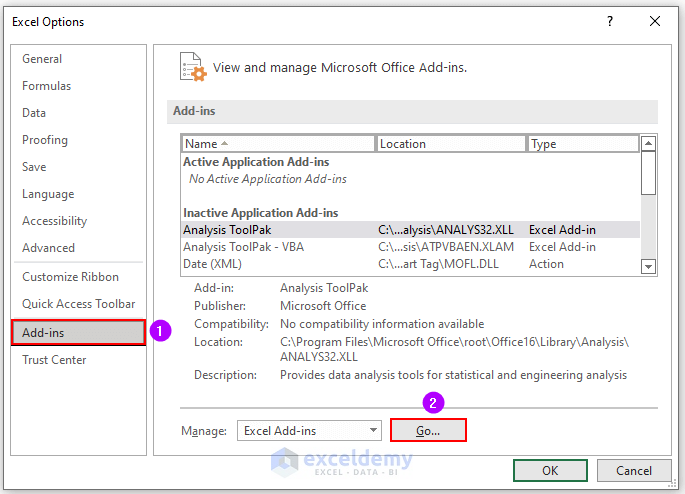
A dialog box will appear.
- Select “Analysis Toolpak” and press OK.
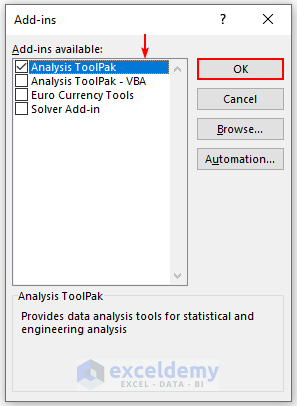
We will enable the Data Analysis feature. The newly created feature can be seen inside the Data tab.
- Click on Data Analysis.

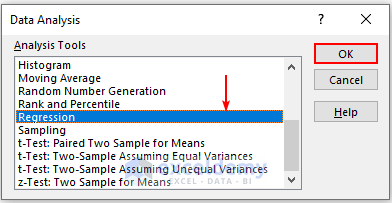
The Data Analysis dialog box will appear.
- Select Regression and press OK.
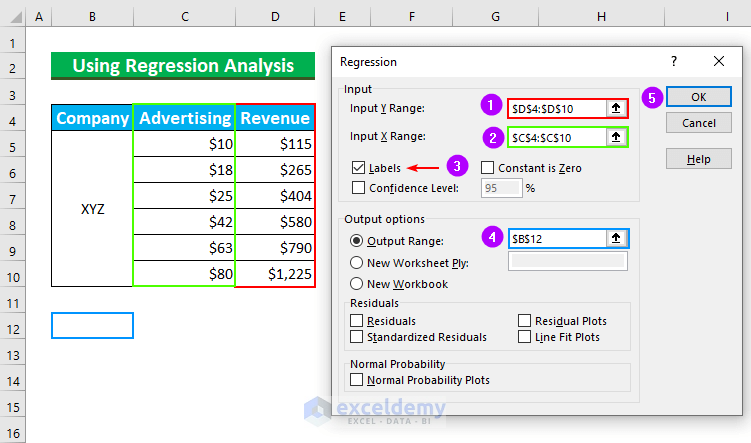
Now, we’ll select the following options inside the Regression dialog box:
- Input Y Range: D4:D10. Here, the Y Range means the Dependent variable (Revenue).
- Input X Range: C4:C10. Here, X Range means Independent variable (Advertising).
- Select Labels.
- Output Range: B12. We’ll put the Regression value here.
- Press OK.
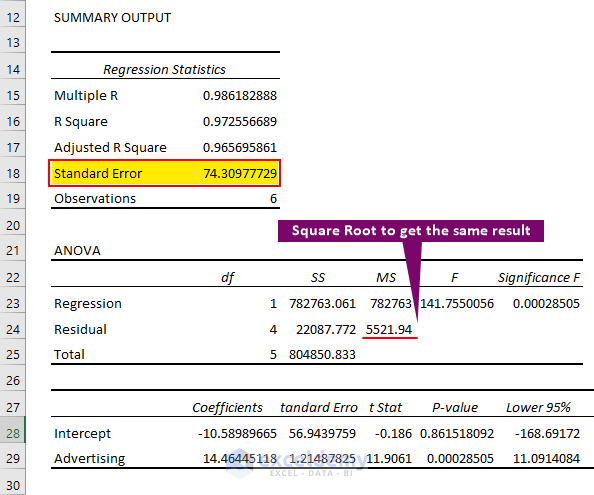
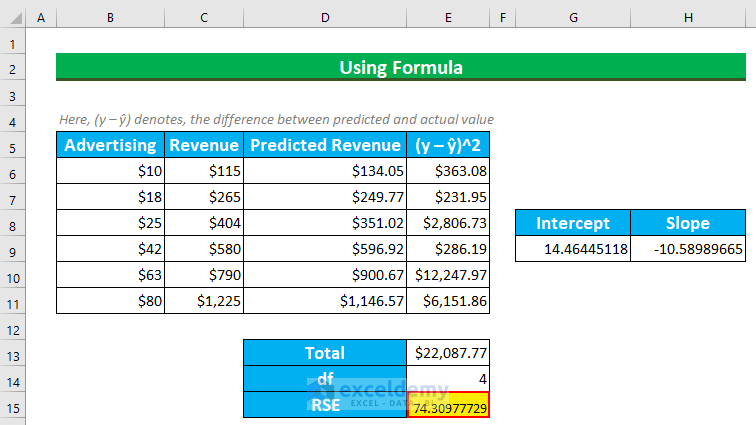
We’ll get our value from the Summary Output—the Standard Error 74.30977729.
We can get it if we Square Root the value of the Mean Square of Residual (5521.94).
Method 2 – Finding the Residual Standard Error Using Generic Formula
We’ve changed our dataset.
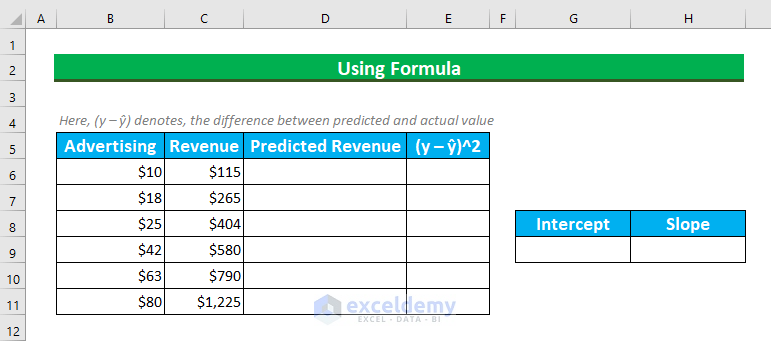
Steps:
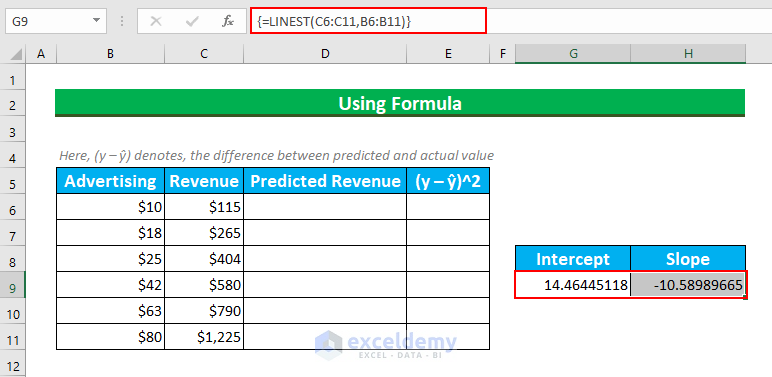
- Select the cell range G9:H9 and enter the following formula:
=LINEST(C6:C11,B6:B11)This function returns statistical values from provided X and Y values. Our y_values are in cell range C6:C11, and the x_values are in cell range B6:B11.
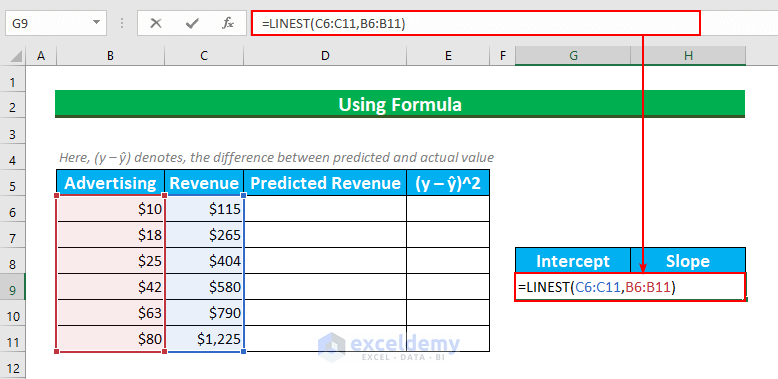
- Press CTRL + ENTER.
This will convert our formula to an array formula, so we’ll see a curly bracket.
We’ll find the Intercept as 14.46445118 and slope -10.58989665. Our Regression equation will be ŷ= -10.59 + 14.46x.
We’ll find the Predicted Revenues.
- Select the cell range D6:D11.
- Enter the following formula:
=$H$9+$G$9*B6We’re using this formula that we got the Regression equation.
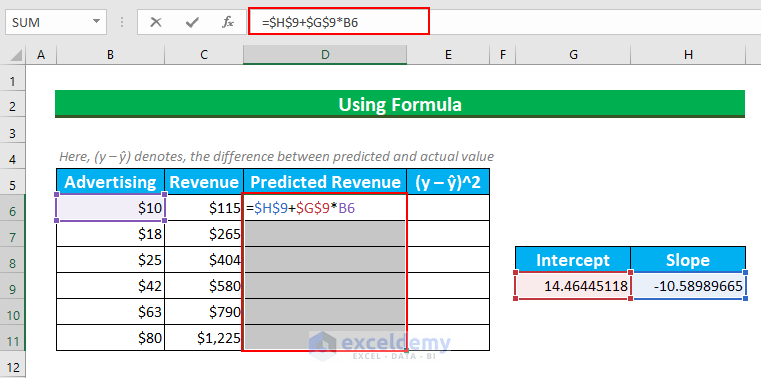
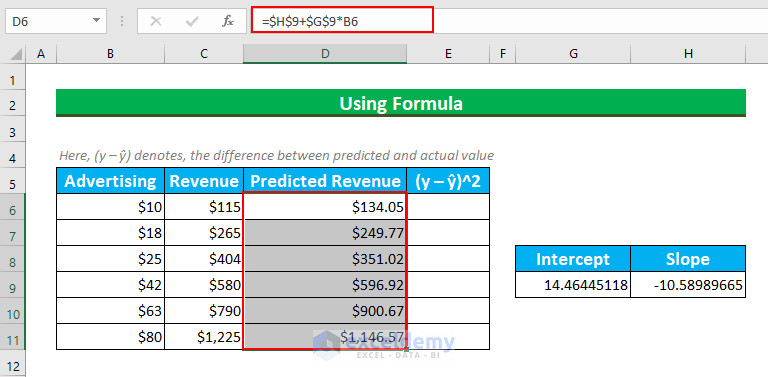
- Press CTRL + ENTER.
We’ll get the Predicted values from this.
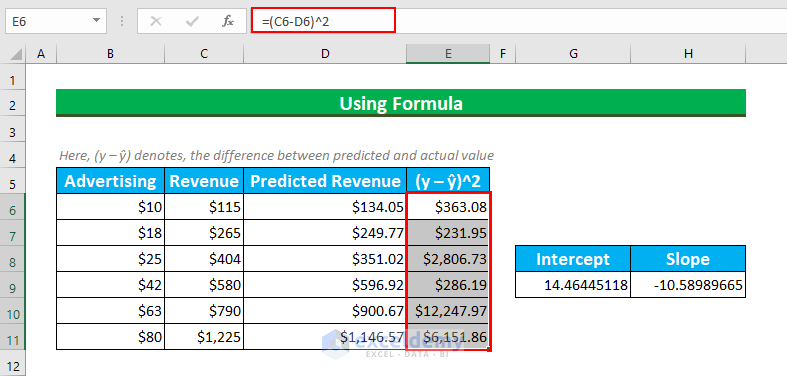
We’ll find the squared difference between predicted and actual values.
- Select the cell range E6:E11 and enter this formula:
=(C6-D6)^2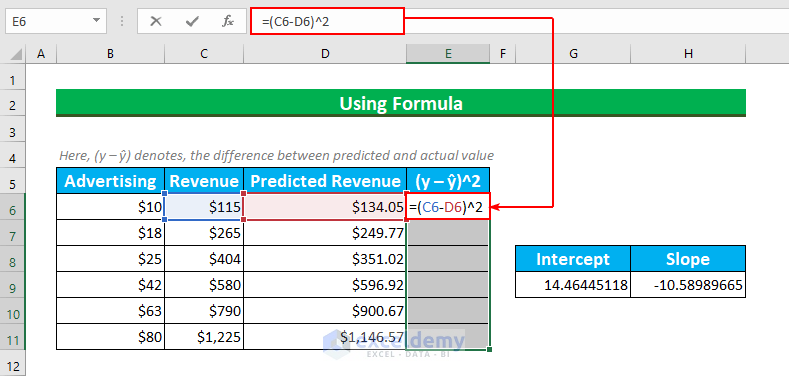
- Press CTRL + ENTER.
- Enter this formula in cell E13:
=SUM(E6:E11)We’re adding all the values from cell E6 to E11.
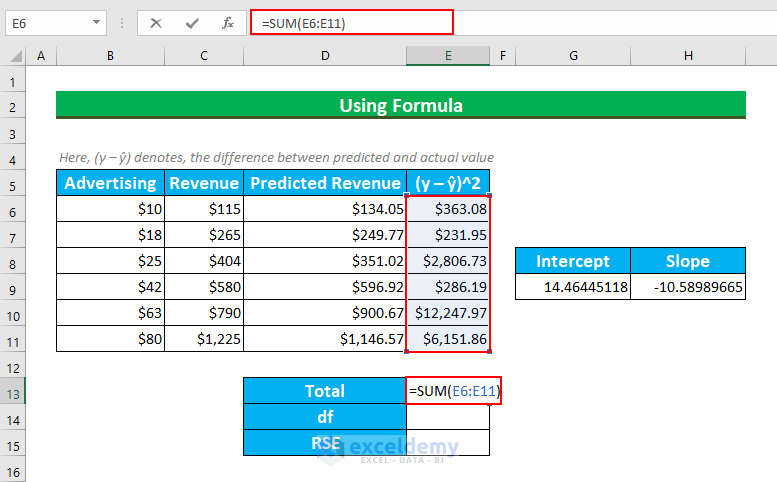
Here, df means degrees of freedom. We have 6 values in our dataset, and there are 2 parameters in our dataset. Hence our df = 6-2 = 4.
Then, we’ll find the value of Residual Standard Error.
- Enter this formula in cell E15:
=SQRT(E13/E14)We’re finding the square root of the cell’s value E13 divided by the value E14.
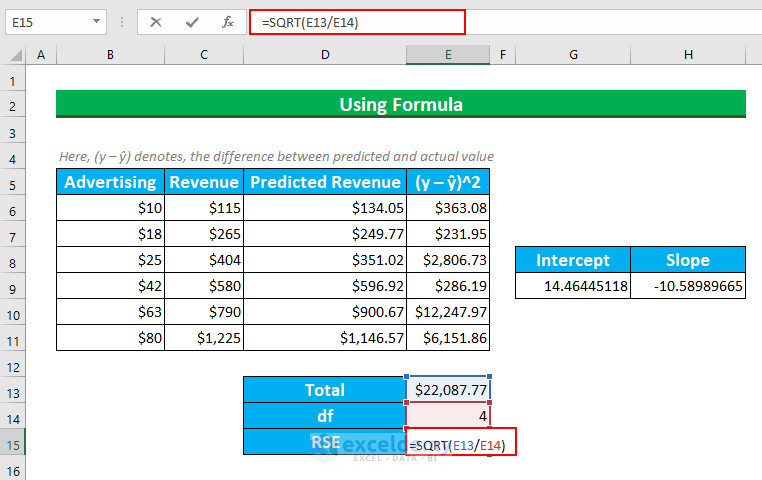
- Press ENTER.
We’ll get our value.
Practice Section
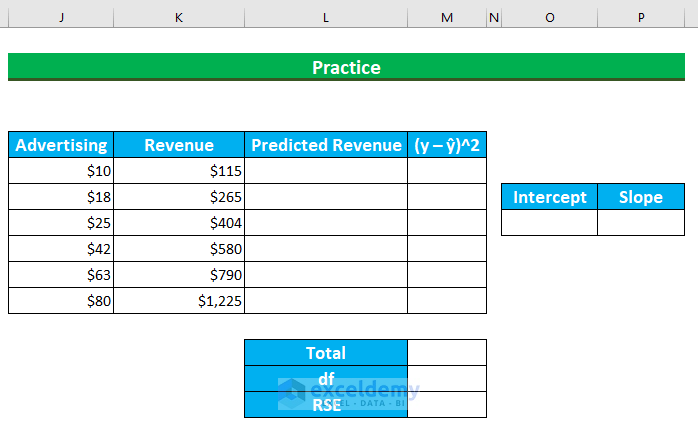
We’ve added a practice dataset in the Excel file.
Download the Practice Workbook
Related Article
<< Go Back to Excel for Statistics | Learn Excel
Get FREE Advanced Excel Exercises with Solutions!

