Example 1 – Using Excel VBA For Each Loop Statement with Range Object
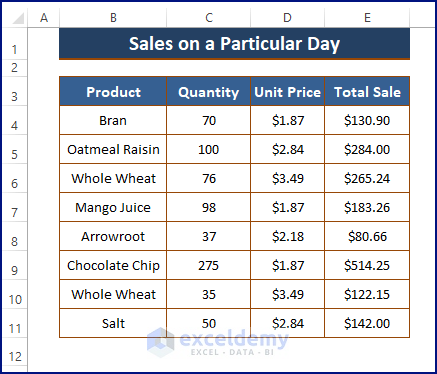
Let’s say we have a workbook with one worksheet, the cells E4: E11 containing numbers. We want to apply to Fill Color and Boldness by assigning the cells as the Range Object using a For Each Loop statement. Additionally, we want to round all the numbers to the nearest integer using the VBA Round function.
- Follow the respective links to insert a Macro Button or Form Control Button or Check Box to run the macro constructed using the VBA For Each Loop. Enter the following macro into the button or box’s space.
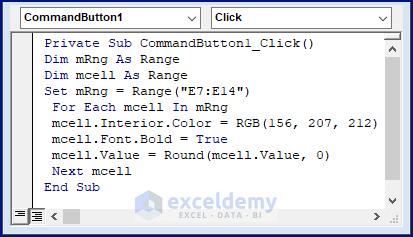
Private Sub CommandButton1_Click()
Dim mRng As Range
Dim mcell As Range
Set mRng = Range("E7:E14")
 For Each mcell In mRng
 mcell.Interior.Color = RGB(156, 207, 212)
 mcell.Font.Bold = True
 mcell.Value = Round(mcell.Value, 0)
 Next mcell
End Sub
Macro Explanation
- In the macro, we use Range Collection.
For Each cell In myRng
………
Next cell- Interior.Color imposes the Fill Color.
cell.Interior.Color = RGB(156, 207, 212)- The VBA ROUND function rounds the range.
cell.Value = Round(cell.Value, 0)- Return to the worksheet and make sure Design Mode is not activated.
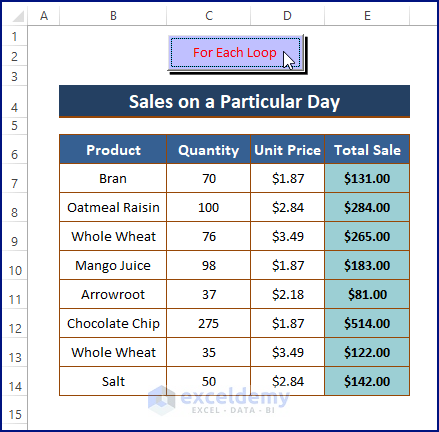
- Click on the button and the cells specified in the code. Excel fills the cells with a Light Blue Color, bolds the font and rounds the numbers to the nearest integer.
Read More: How to Use For Next Loop in Excel VBA
Example 2 – Nesting For Each Loop with Tables as ListObjects in Excel VBA
Excel Tables refer to structured ranges with designated column headers and data organized in rows and columns. Excel tables are dynamic, which means that they grow as data is added. Macros refer to tables using the standard method of referring to a range name. In this case, users would use the table name.
For example, let’s say one had a table named Sales on sheet 1 in the workbook. Users can refer to the data in the table in Excel VBA using the following code:
Worksheets(1).Range("Sales")
If users want to refer to the Header Row, the Totals Row, and all the data in the table in Excel VBA, they need to use the following code:
Worksheets(1).Range("ProductT[#All]")
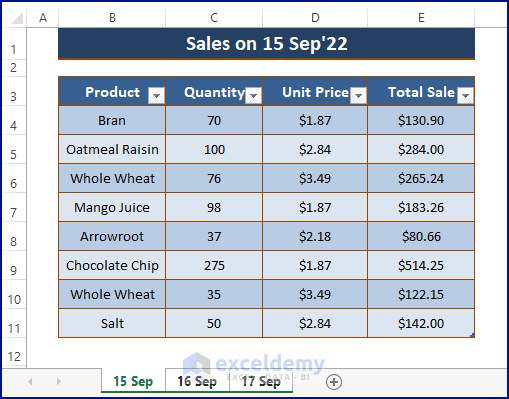
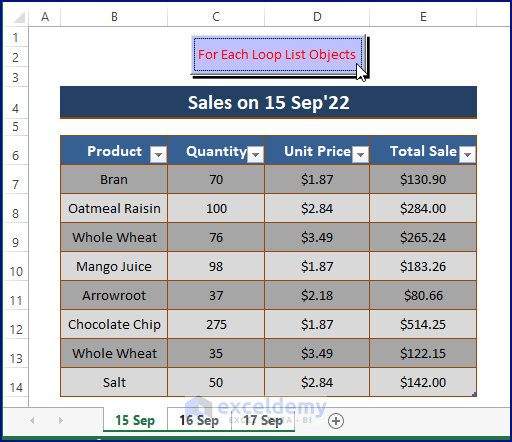
Users can also refer to tables using the ListObjects collection. Using a nested For Each Loop statement, we can change all the tables from the default style to Table Style Medium 8. The image below displays identical tables used as a dataset.
- Replace the previous macro with the latter one assigned to the Macro Button or Form Control.
Private Sub CommandButton1_Click()
Dim wrksht As Worksheet
Dim mtable As ListObject
 For Each wrksht In Worksheets
  For Each mtable In wrksht.ListObjects
  mtable.TableStyle = "TableStyleMedium8"
  Next mtable
 Next wrksht
End Sub
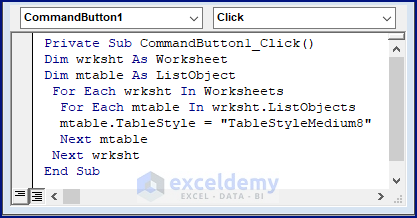
Macro Explanation
- The macro uses assigned Tables as List Objects.
Dim mtable As ListObject- For Each Loop takes the worksheets and the nested For Each Loop goes through each table to custom style them.
 For Each wrksht In Worksheets
  For Each mtable In wrksht.ListObjects
 ………………………………………………
  Next mtable
Next wrksht- TableStyle sets the custom table style.
mtable.TableStyle = "TableStyleMedium8"
- Return to the worksheet, make sure Design Mode is not activated.
- Click on the Button.
- All the tables on each of the worksheets containing tables in the workbook are now changed to Table Medium Style 8.
Read More: How to Use VBA for Each Row in a Range in Excel
Example 3 – Applying Nested For Each Loop in Excel VBA with ChartObjects
We have a workbook with three identical worksheets. There is also a chart on each worksheet. This type of chart is referred to as an embedded chart, it’s different from a chart sheet. The difference between the two is that the parent object of a chart sheet is a workbook object, whereas the embedded chart’s parent object is a ChartObject. The parent of a ChartObject is a worksheet.
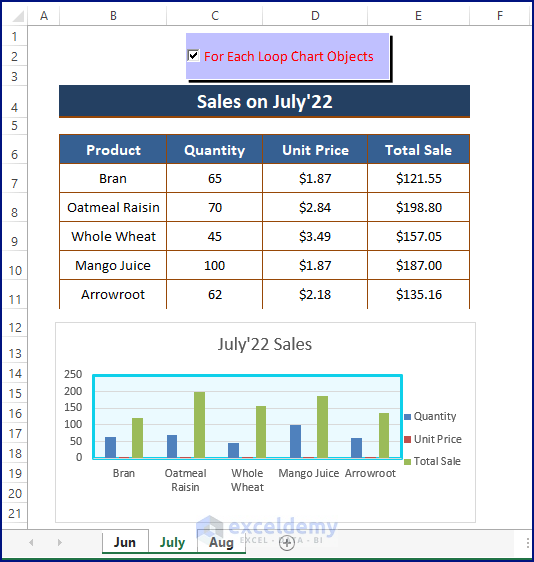
Our aim is to fill the plot area of all the charts in our workbook with a Light Blue Color, and the line surrounding the plot area to a Blue Color with a Width of 2, when we click on the Macro CheckBox button. Additionally, we’d like the plot area to have a No Fill area and No Line (as it is in the default chart option) when we click the button again. 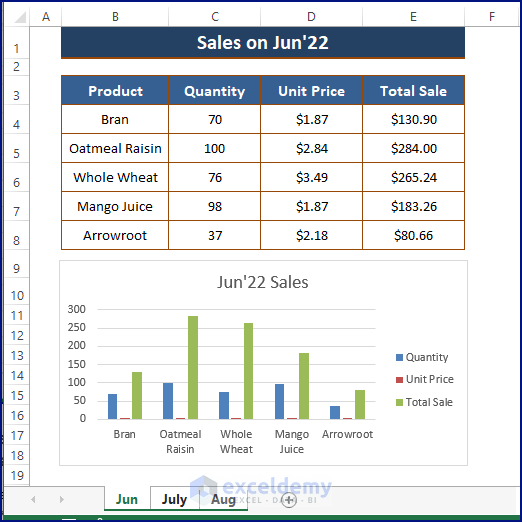
- Use the following macro in CheckBox’s space.
Private Sub CheckBox1_Click()
Dim wrksht As Worksheet
Dim mchrt As ChartObject
 If CheckBox1.Value = True Then
  For Each wrksht In Worksheets
   For Each mchrt In wrksht.ChartObjects
   mchrt.Chart.PlotArea.Format.Fill.Visible = msoTrue
   mchrt.Chart.PlotArea.Format.Fill.ForeColor.RGB = RGB(235, 250, 255)
   mchrt.Chart.PlotArea.Format.Line.Visible = msoTrue
   mchrt.Chart.PlotArea.Format.Line.ForeColor.RGB = RGB(14, 208, 234)
   mchrt.Chart.PlotArea.Format.Line.Weight = 2
   Next mchrt
  Next wrksht
 ElseIf CheckBox1.Value = False Then
  For Each wrksht In Worksheets
   For Each mchrt In wrksht.ChartObjects
   mchrt.Chart.PlotArea.Format.Fill.Visible = msoFalse
   mchrt.Chart.PlotArea.Format.Line.Visible = msoFalse
   Next mchrt
  Next wrksht
 End If
End Sub
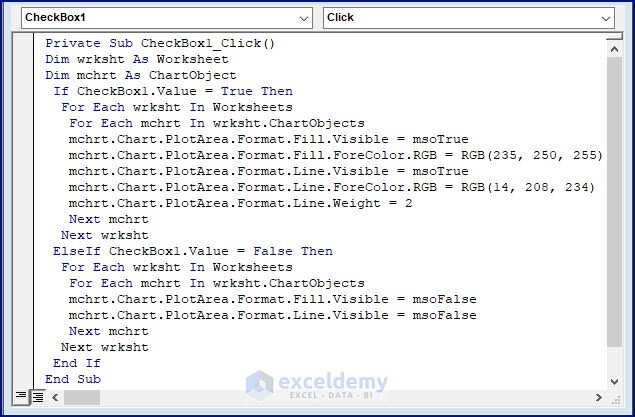
Macro Explanation
- The macro applies custom formatting using the VBA IF function.
If CheckBox1.Value = True Then- Nested For Each Loop carries out worksheet by worksheet and chart by chart formatting.
For Each wrksht In Worksheets
   For Each mchrt In wrksht.ChartObjects
   mchrt.Chart.PlotArea.Format.Fill.Visible = msoTrue
   mchrt.Chart.PlotArea.Format.Fill.ForeColor.RGB = RGB(235, 250, 255)
   mchrt.Chart.PlotArea.Format.Line.Visible = msoTrue
   mchrt.Chart.PlotArea.Format.Line.ForeColor.RGB = RGB(14, 208, 234)
   mchrt.Chart.PlotArea.Format.Line.Weight = 2
   Next mchrt
Next wrksht- Upon double-clicking on the button, Excel clears the formatting.
- After assigning the macro, click on the Check Box to impose a custom format on the Charts.
Read More: Loop through a Range for Each Cell with Excel VBA
Things to Remember
- Clearing the checkbox clears the formatting.
- If you haven’t already done so, save the workbook as a macro-enabled workbook.
Download Workbook


