I have a workbook that I provide a filter to isolate a producer. Each producer publishes a variable number of products. The products are listed in a column, normally multiple products for each product type, but may be only one. I need to present the number of each product type in a pie chart and am seeking an approach that provides the number of each unique products published. As I am automating the process I am seeking a formula or VBA approach that will present the number for each unique publication without further interaction. If this has been done and I have not located the file it is because I do not know how to ask the question in fewer words. Thanks for your assistance!
You are using an out of date browser. It may not display this or other websites correctly.
You should upgrade or use an alternative browser.
You should upgrade or use an alternative browser.
[Solved] Iteration of unique text from columns
- Thread starter drew7ster
- Start date
Sishir Roy
New member
Dear Drew7ster,I have a workbook that I provide a filter to isolate a producer. Each producer publishes a variable number of products. The products are listed in a column, normally multiple products for each product type, but may be only one. I need to present the number of each product type in a pie chart and am seeking an approach that provides the number of each unique products published. As I am automating the process I am seeking a formula or VBA approach that will present the number for each unique publication without further interaction. If this has been done and I have not located the file it is because I do not know how to ask the question in fewer words. Thanks for your assistance!
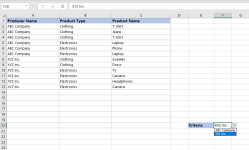
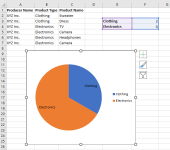
I created a sample dataset to illustrate your issue. I'll create a pie chart using this dataset to show the percentages of each product type produced by each producer. In order to do this, I've made a drop-down list in Cell F20 that will periodically get the value of each producer. After selecting a producer from the drop-down list and executing the VBA code, the pie chart will show up in Sheet2 for that producer. Make sure you run the FilteringProducer macro from the VBA module.
Dataset:
Output:
Excel VBA Code:
Code:
Sub FilteringProducer()

    On Error Resume Next
    Dim SP, DSP As Worksheet
    Dim lstRow As Integer

    Set SP = ThisWorkbook.Sheets("Sheet1")
    Set DSP = ThisWorkbook.Sheets("Sheet2")

    SP.Activate

    SP.AutoFilterMode = False

    SP.UsedRange.AutoFilter 1, "=" & Range("F20").Value

    DSP.AutoFilterMode = False

    DSP.Cells.ClearContents
    DSP.ChartObjects.Delete

    SP.UsedRange.Copy
    DSP.Range("A1").PasteSpecial xlPasteValuesAndNumberFormats

    SP.AutoFilterMode = False

    Call FindUniqueValues
    Call DrawPieChart

End Sub

Sub FindUniqueValues()

    Dim uniqueValues As Variant
    Dim i As Long
    Dim j As Long
    Dim freq As Long

    Sheets("Sheet2").Activate
    uniqueValues = getUniqueValues(Range("B2:B" & Range("B" & Rows.Count).End(xlUp).Row))

    Range("E2:F" & Range("E" & Rows.Count).End(xlUp).Row).ClearContents

    For i = LBound(uniqueValues) To UBound(uniqueValues)
        freq = 0
        For j = 2 To Range("B" & Rows.Count).End(xlUp).Row
            If Range("B" & j).Value = uniqueValues(i) Then
                freq = freq + 1
            End If
        Next j
        Sheets("Sheet2").Range("E" & (i + 2)).Value = uniqueValues(i)
        Sheets("Sheet2").Range("F" & (i + 2)).Value = freq
    Next i

End Sub

Function getUniqueValues(rng As Range) As Variant

    Dim uniqueValues() As Variant
    Dim cellValue As Variant
    Dim i As Long, j As Long
    Dim isUnique As Boolean

    ReDim uniqueValues(1 To 1)
    Sheets("Sheet2").Activate
    uniqueValues(1) = rng.Cells(1, 1).Value

    For i = 2 To rng.Cells.Count
        cellValue = rng.Cells(i, 1).Value
        If Not IsEmpty(cellValue) Then
            isUnique = True
            For j = 1 To UBound(uniqueValues)
                If uniqueValues(j) = cellValue Then
                    isUnique = False
                    Exit For
                End If
            Next j

            If isUnique Then
                ReDim Preserve uniqueValues(1 To UBound(uniqueValues) + 1)
                uniqueValues(UBound(uniqueValues)) = cellValue
            End If
        End If
    Next i

    getUniqueValues = uniqueValues

End Function

Sub DrawPieChart()

    Dim dataRange As Range
    Dim ws As Worksheet
    Dim chartRange As Range
    Dim chartObj As ChartObject
    Dim i, lastRow As Integer

    Set ws = ThisWorkbook.Sheets("Sheet2")
    lastRow = ws.Cells(Rows.Count, 5).End(xlUp).Row

    Set dataRange = ActiveSheet.Range("E3:F" & lastRow).SpecialCells(xlCellTypeConstants)

    Set chartRange = ws.Range("C8").Resize(dataRange.Rows.Count, dataRange.Columns.Count)

    Set chartObj = ActiveSheet.ChartObjects.Add(Left:=100, Width:=300, Top:=100, Height:=300)

    chartObj.Chart.ChartType = xlPie

    chartObj.Chart.SetSourceData Source:=dataRange

    chartObj.Left = 100
    chartObj.Top = 100
    chartObj.Width = 300
    chartObj.Height = 300

    For i = 1 To dataRange.Rows.Count
        chartObj.Chart.SeriesCollection(1).Points(i).HasDataLabel = True
        chartObj.Chart.SeriesCollection(1).Points(i).DataLabel.Text = dataRange(i, 1).Value
    Next i

End Sub
Please feel free to ask any questions if you face any problems regarding this. Also, you can read the following article:
How to Count Frequency of Unique Values in a Column in Excel
Regards,
Sishir Roy


