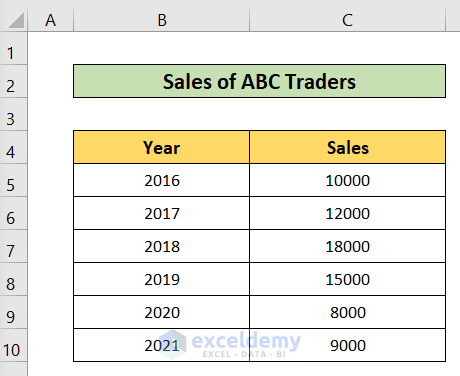
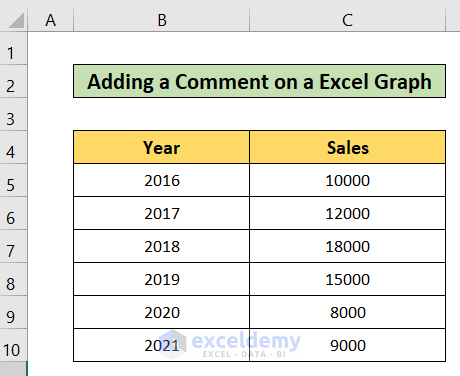
We will consider a dataset of Sales of ABC Traders from B4 to C10. We will add a chart and add a comment on it.
Method 1 – Adding a Comment on a Graph in Excel by Using a Text Box
We will use a text box to add a comment on an Excel graph.
Steps:
- Add a chart.
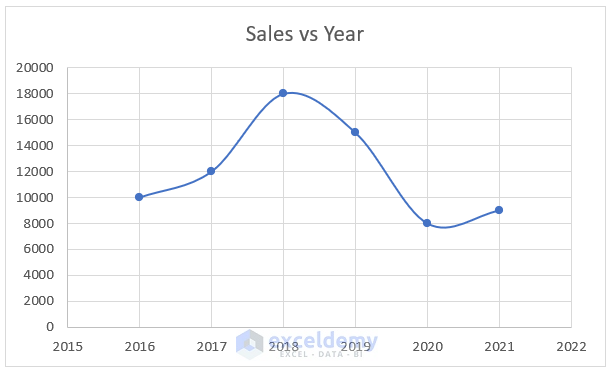
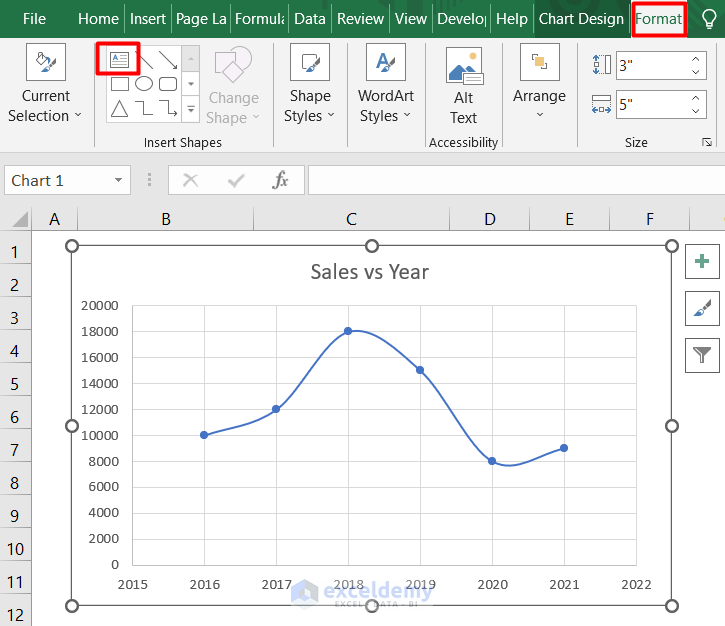
- Select the chart.
- Go to the Format tab.
- Select the Text Box option in Insert Shapes.
- Add the text box inside the chart below the line.
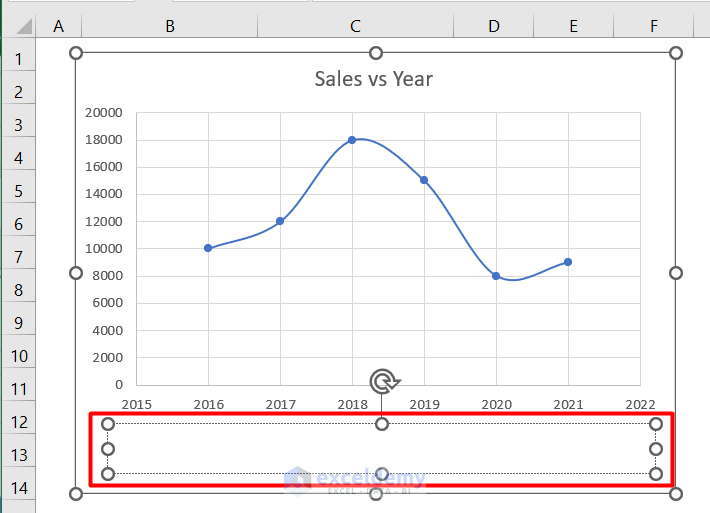
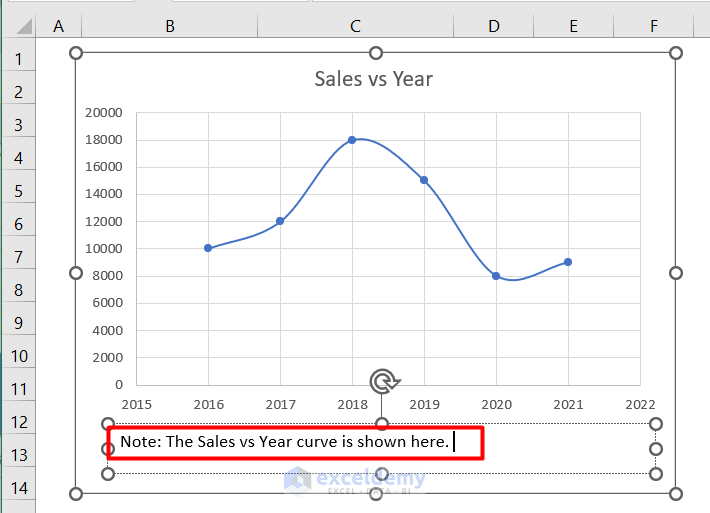
- Add a note or comment in the text box.
Method 2 – Inserting a Comment on a Graph in Excel from a Data Label
Steps:
- To label one particular data point, click the data series and click that target data point after clicking the series.
- Right-click on the highlighted data point.
- Select the Add Data Label option from the context menu.
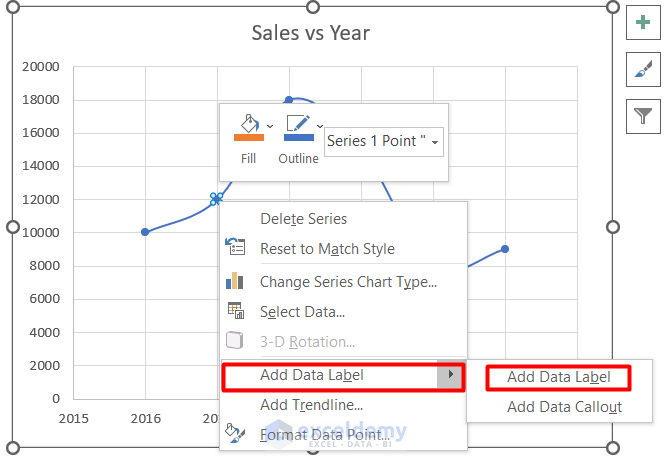
- You will find a data label beside the data point.
- Right-click on the data label.
- Click on Change Data Label Shapes.
- Select a data label shape option.
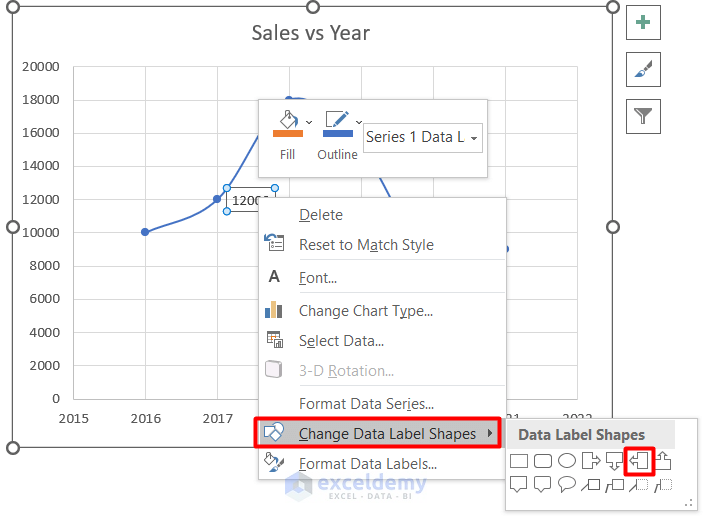
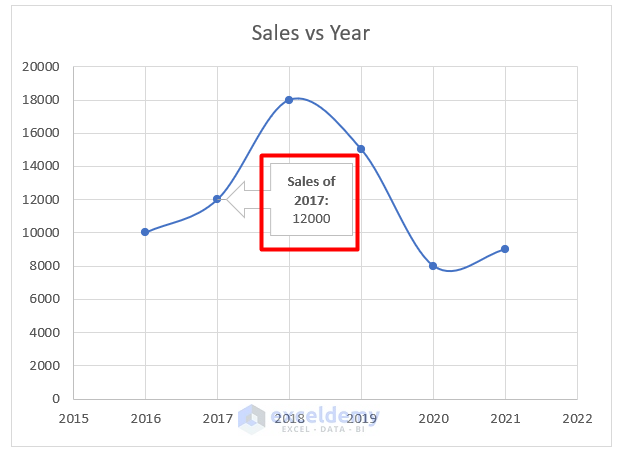
- You will get a comment box like the picture given below.
Method 3 – Add a Comment on a Graph in Excel Using the Insert Tab
Steps:
- Go to the Insert tab in your Excel 365.
- Select the Add Text button.
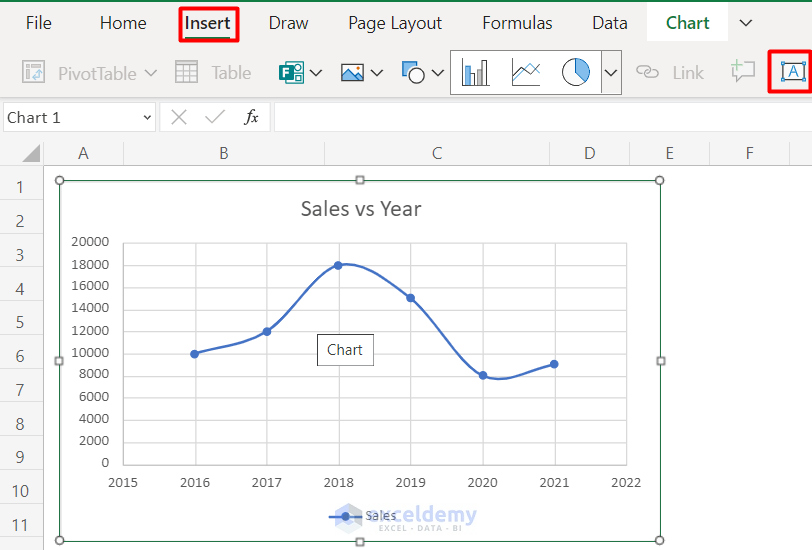
- Add the text box to the graph.
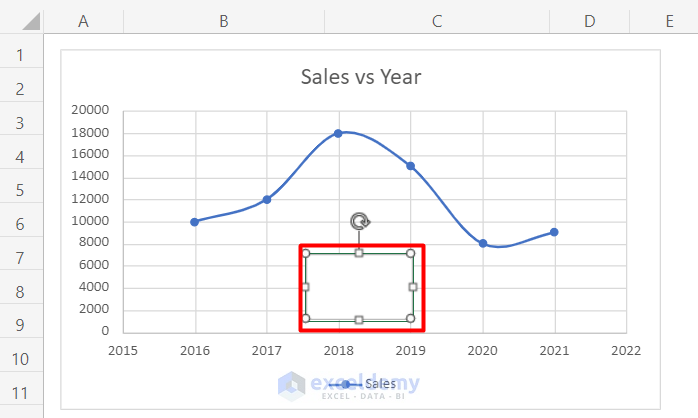
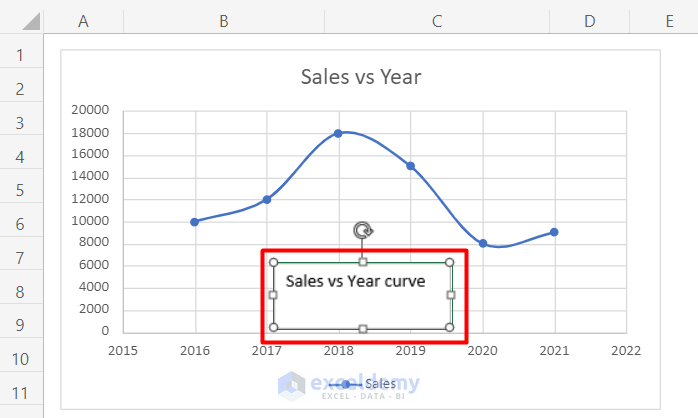
- Write down the comment in the textbox.
How to Add Comments to an Excel Worksheet
Steps:
- Select the C5 cell.
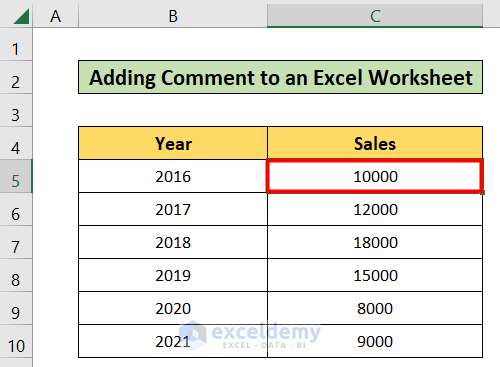
- Go to the Review tab.
- Select Edit Comment or Add Comment
- A comment box is opened.
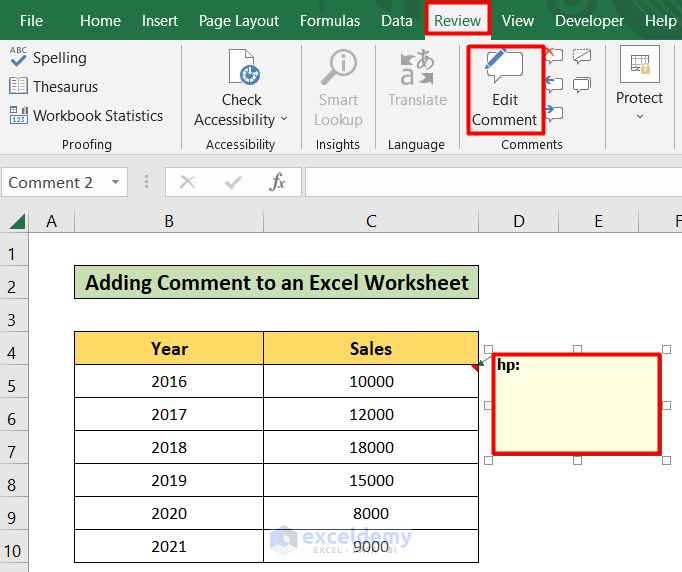
- You can write any comments in the dialog box.
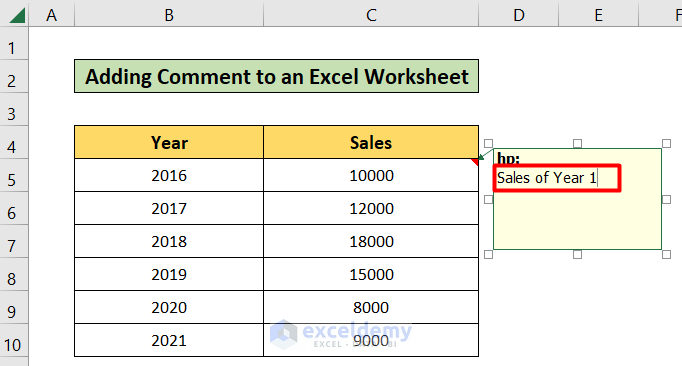
- You will find the added comments in a cell just like the picture given below.
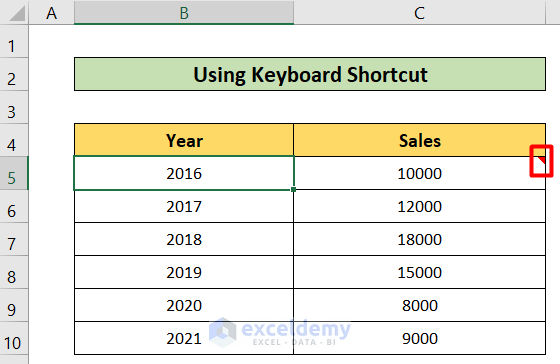
- You can read or edit the comment by clicking on the small arrow on the top-right of the cell.
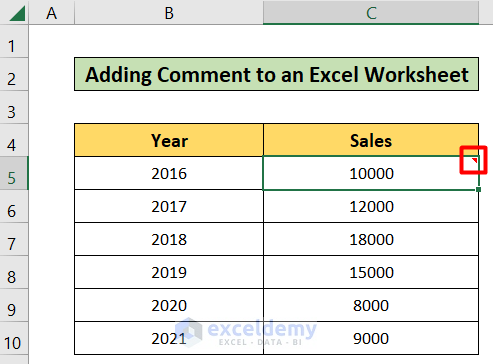
How to Add Comments in Excel Worksheet with a Keyboard Shortcut
Steps:
- Select the C5 cell.
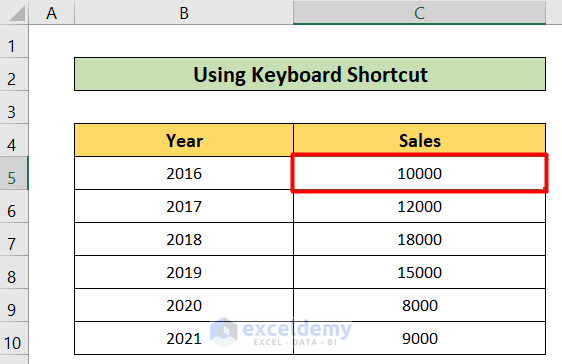
- Press Shift + F2.
- A comment box will open in the cell like in the picture below. You can write any comments in that dialog box.
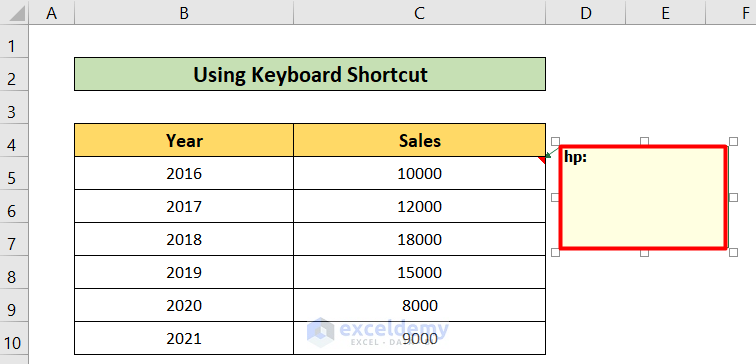
- The selected area will help you to edit the comments by clicking on it.
Download the Practice Workbook
Related Article
<< Go Back to How to Add a Comment in Excel | Comments in Excel | Learn Excel
Get FREE Advanced Excel Exercises with Solutions!


This is very helpful for my work.
To place a Data label on a data point, must click data point 2x, 1st click selects the series, 2nd click selects the point
Thank you so much for the useful note, ASD. We have included it in the article for our users to understand that step better. Much appreciation from ExcelDemy. Keep sharing your experience with us.