Definition of Differentiation
Differentiation means the rate of change between two individual quantities or values. The ratio of the small change in one value is dependent on the first value given in the function. The basic formula for differentiation is dy/dx, where y=f(x).
Differential vs. Derivative
Differential and Derivative are two intimately connected terms in calculus. The term derivative means the rate of change of one variable with respect to another one. Here, variables are the changing entities.
the differential equation defines the relationship between the variables and derivatives.
Rules of Differentiation
When a differentiation point is 0, the function remains continuous. Otherwise, for each interval of position, it sets a new product relating to the values. The differentiation rules are:
1. Constant Rule: d[C]/dx=0
2. Power Rule: dx^n/dx=nx^n-1
3. Product Rule: d[f(x)g(x)]/dx=f’(x)g(x)+f(x)g’(x)
4. Quotient Rule: d/dx[f(x)/g(x)]=[g(x)f’(x)-f(x)g’(x)]/[g(x)]^2
5. Chain Rule: d/dx[f(g(x))]=f’(g(x))g’(x)
Step 1: Insert Horizontal Axis Values
- Insert the value of x in B5:B13.
- Make sure to enter the starting point 0.
- Insert the value of n.
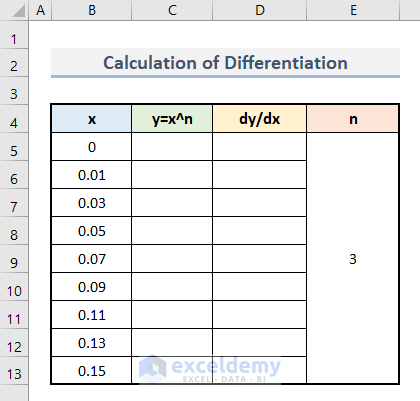
Step 2: Find Vertical Axis Values
To calculate the value of y for each value of x, use this function:
y=x^n- Enter this formula in C5.
=B5^$E$5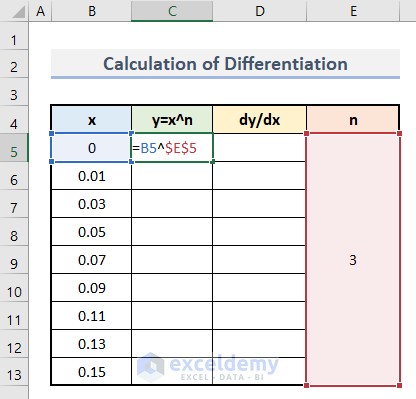
- Press Enter.
- You will see the first output of y.
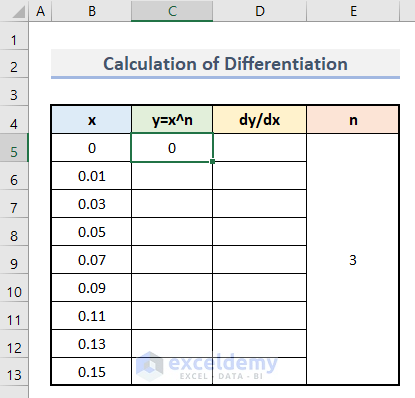
- Drag down the AutoFill to apply the formula to the rest of the cells.
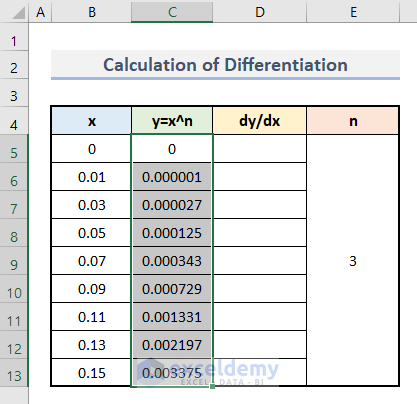
Step 3: Calculate Differentiation
- Enter this formula in D5.
=(C6-C5)/(B6-B5)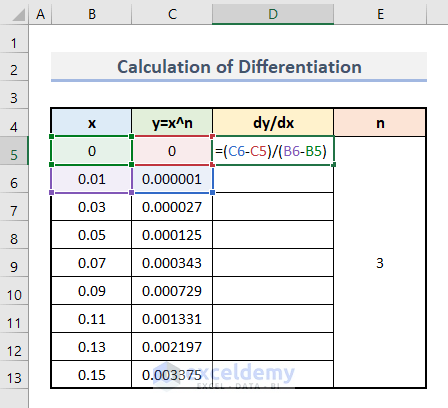
dy is the difference between the last value and the immediately previous value of the column y. (dx is a similar function)
- Press Enter.
This is the output.
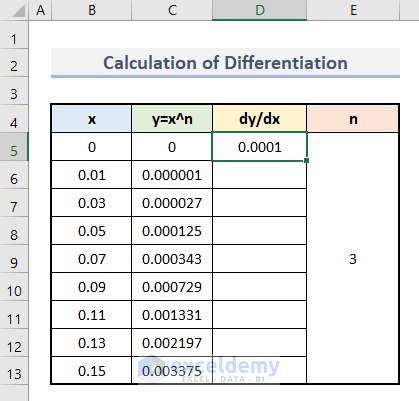
- Apply the same procedure to each set of values.
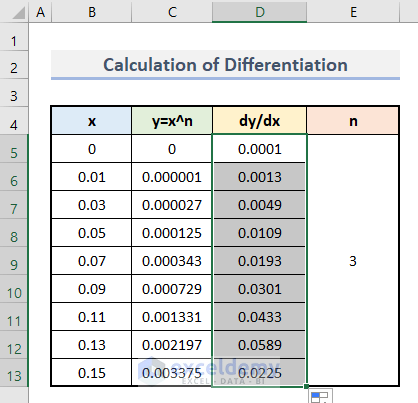
Step 4: Prepare a Differentiation Graph
- Select B4:B13 and D4:D13.
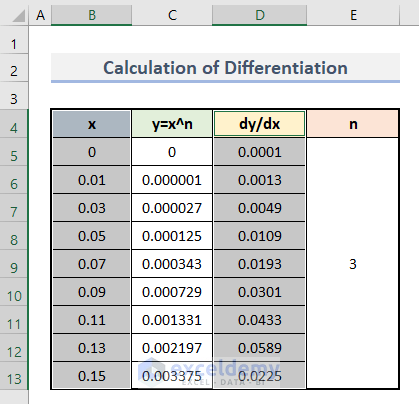
- Go to the Insert tab and click Scatter in Charts.

- Select Scatter with Smooth Lines and Markers.
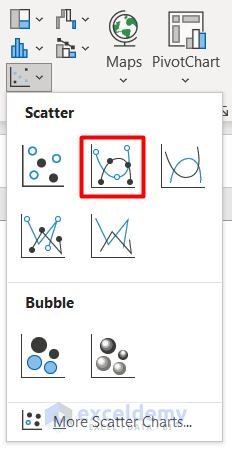
- Your initial graph based on the differential value vs. value of x will be displayed.
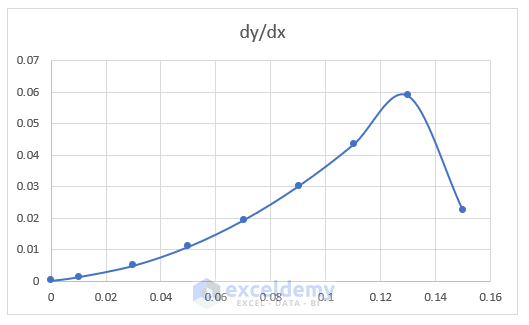
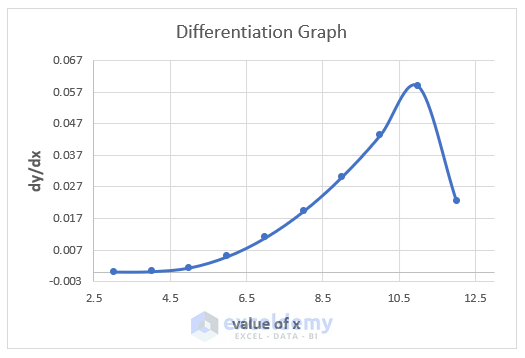
This is the final output:
Example: Calculate Velocity with Differentiation in Excel
- Enter the values of time and distance in columns B and C.
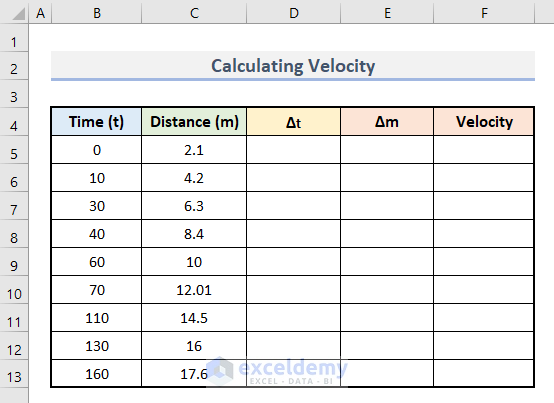
- Enter this formula in D6 to calculate delta t.
=B6-B5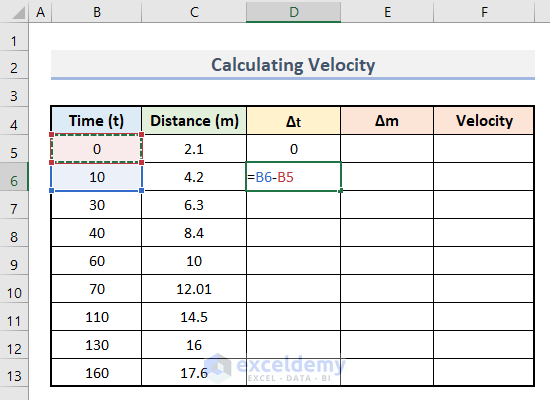
- Press Enter.
- Drag the bottom corner of D7 up to D13 to find all values.
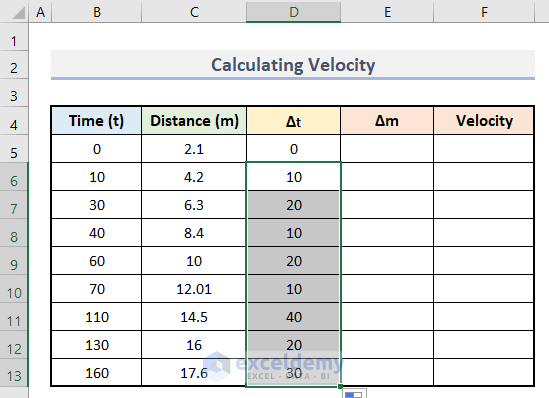
- Enter this formula in E6.
=C6-C5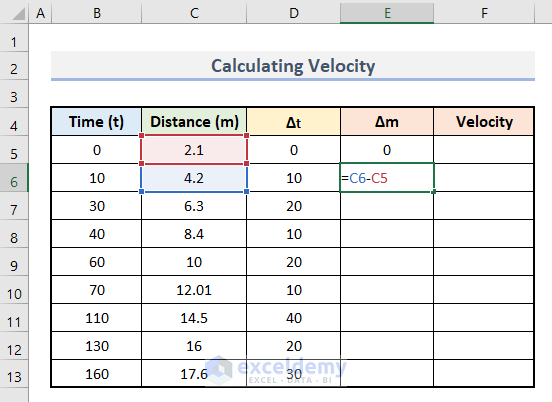
- Press Enter.
- Use the AutoFill to drag down the formula.
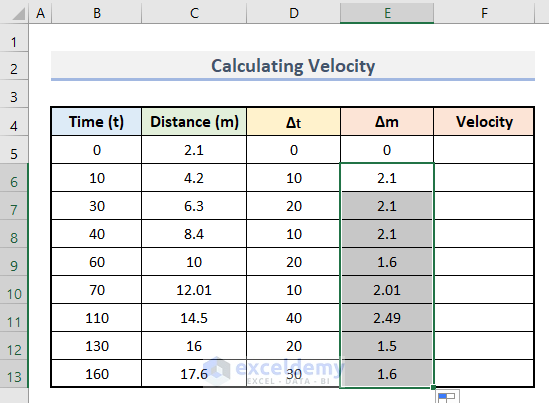
- Enter this formula in F6.
=E6/D6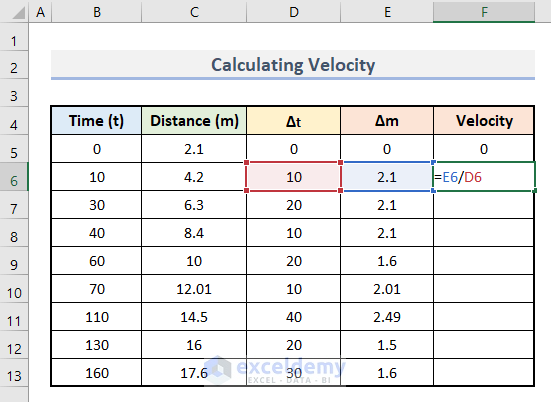
- Use the AutoFill to drag down the formula.
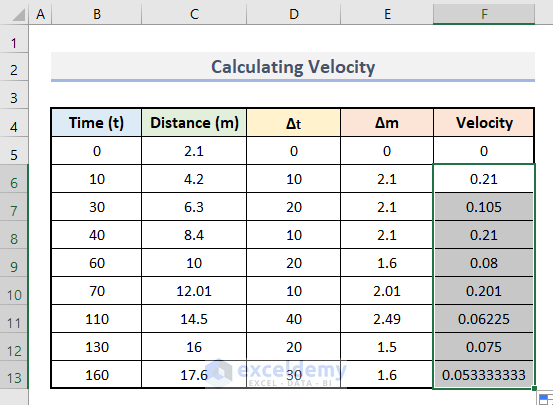
The values of velocity with differentiation are calculated.
- You can create a graph:
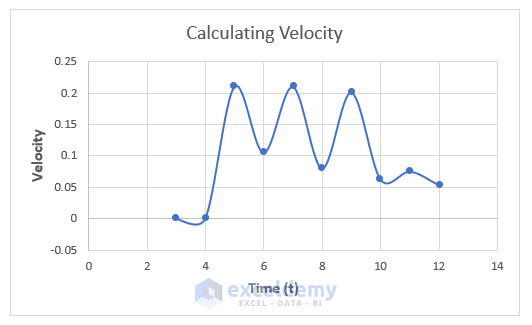
Things to Remember
- The constant value of differentiation is always 0 in the power rule.
- Make sure to insert a starting point.
Download Workbook
Practice here.
<< Go Back to | Calculus in Excel | Excel for Math | Learn Excel
Get FREE Advanced Excel Exercises with Solutions!

