Method 1 – Calculate Average Annual Population Growth Rate
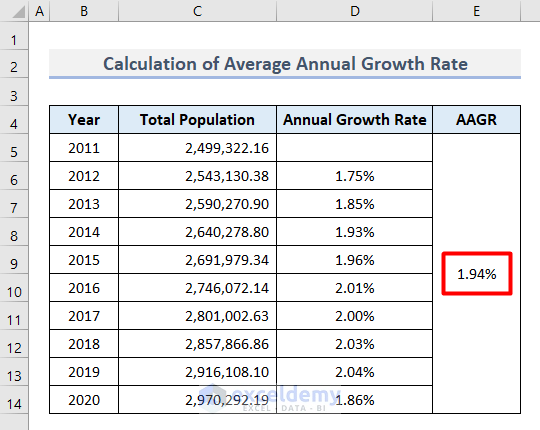
Find out the average annual growth rate of the population. Find the growth rate for each year first, and then we will use the AVERAGE function to get the final output. The basic formula to find individual growth rate is,
=(Ending Value / Beginning Value) – 1
- Select cell D6 to insert this formula.
=(C6-C5)/C5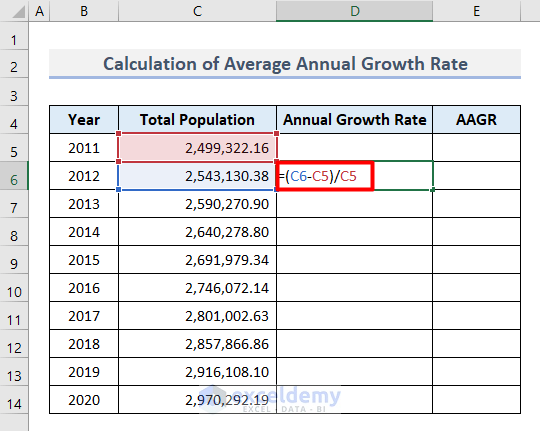
- Press Enter to see the Annual Growth Rate as a decimal number. But we need the output in a percentage.
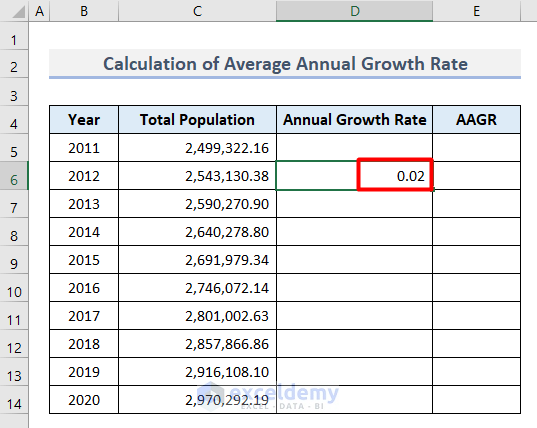
- Go to the Home tab and select Percentage from the drop-down menu in the Number group.

- Increase or decrease decimal places by clicking on the icons as shown below.

- Use the AutoFill tool to get the Annual Growth Rate in the cell range D6:D14.
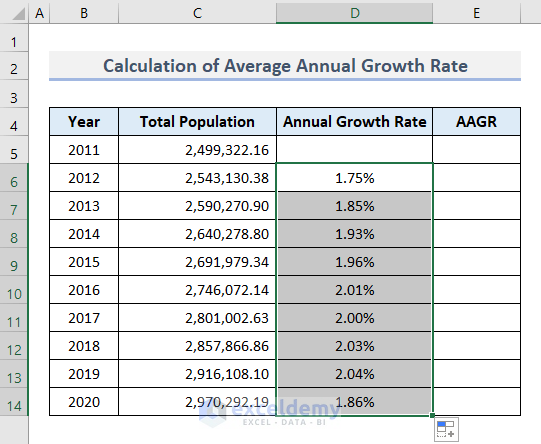
- Insert this formula in cell E5.
=AVERAGE(D6:D14)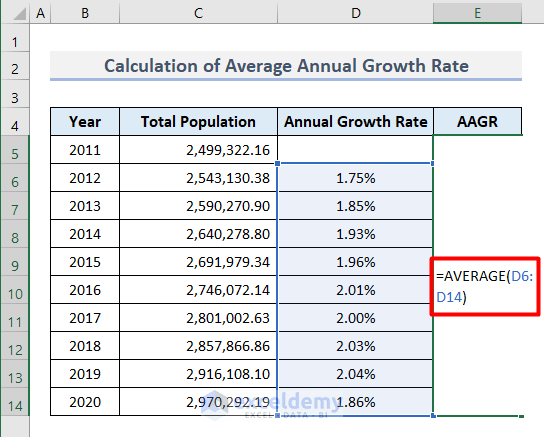
- Press Enter to get the Average Annual Growth Rate (AAGR).
Method 2 – Compound Annual Population Growth Rate Estimation in Excel
2.1. Use Regular Formula
Use the following formula to estimate population growth.
=(Ending Value / Beginning Value)^1 / n – 1
where n = Period of time
Now, follow the steps below.
- Click on cell D5 and type this formula.
=(C14/C5)^(1/(10-1))-1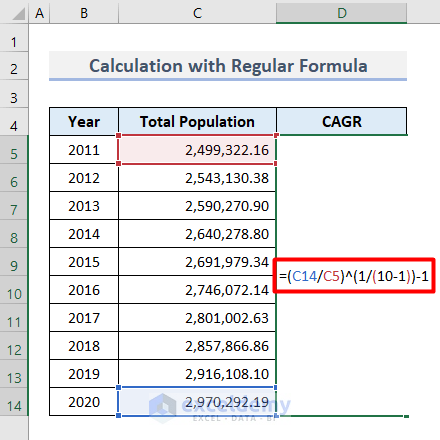
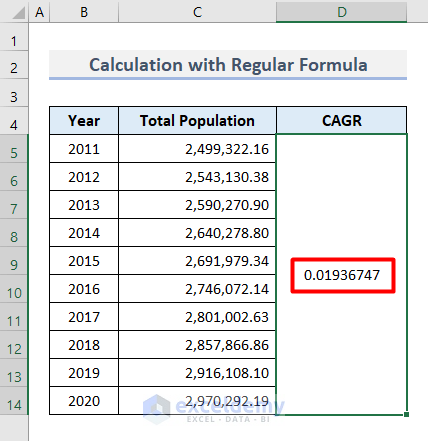
- Hit Enter.
- See the output is showing as a decimal number.
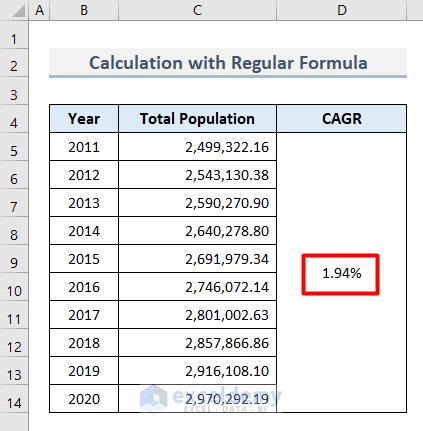
- Change the format into Percentage as discussed in the first method.
- Get the Compound Annual Growth Rate (CAGR).
2.2. Apply XIRR Function
XIRR(value, date, [guess])
Here, value = Beginning Value: Ending Value
date = Beginning Date: Ending Date
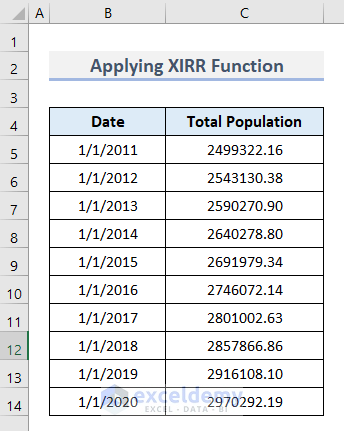
- We typed the time periods as dates in a span of 10 years in cell range B5:B14.
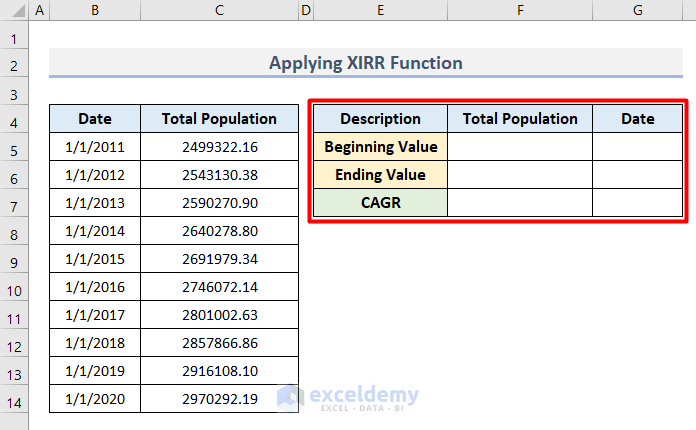
- Create a new table to insert Beginning and Ending Values and calculate the CAGR.
- Insert the cell reference of the beginning value for the total population in cell F5.
=C5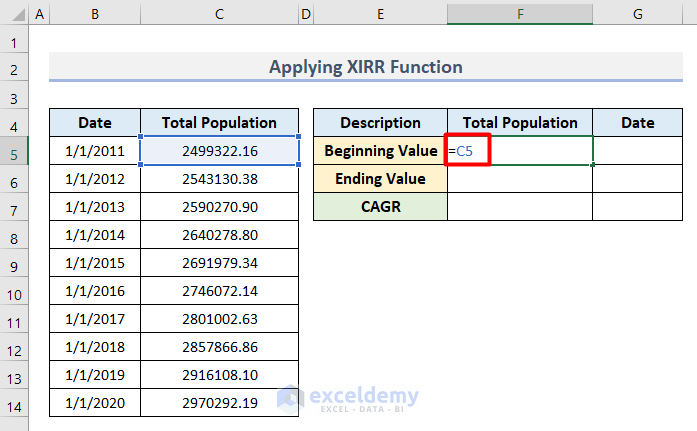
- Type this formula in cell G5.
=B5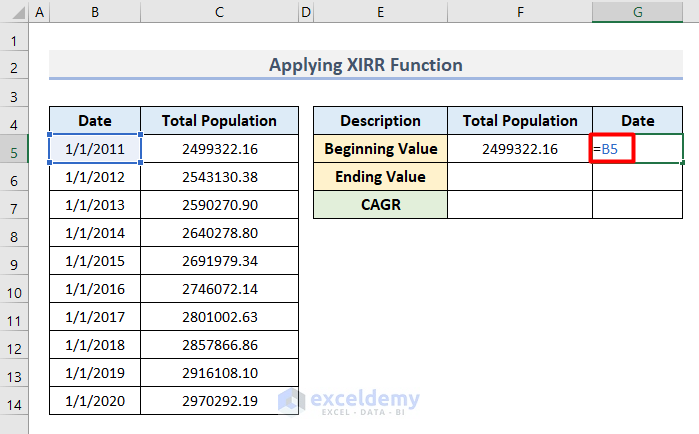
- Type this formula in cell F6.
=-C14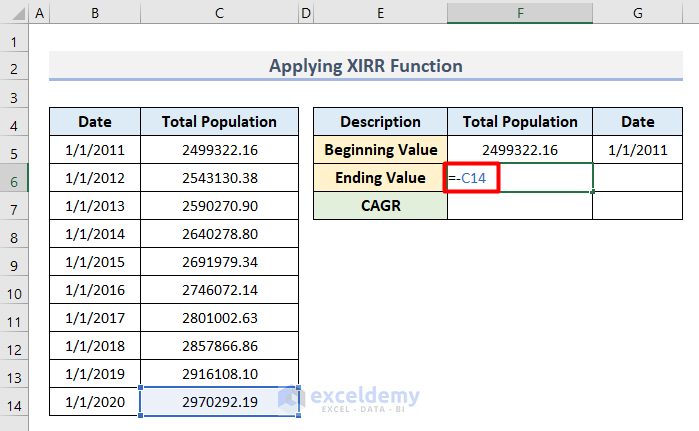
- Insert the cell reference of B14 in cell G6 with this formula.
=B14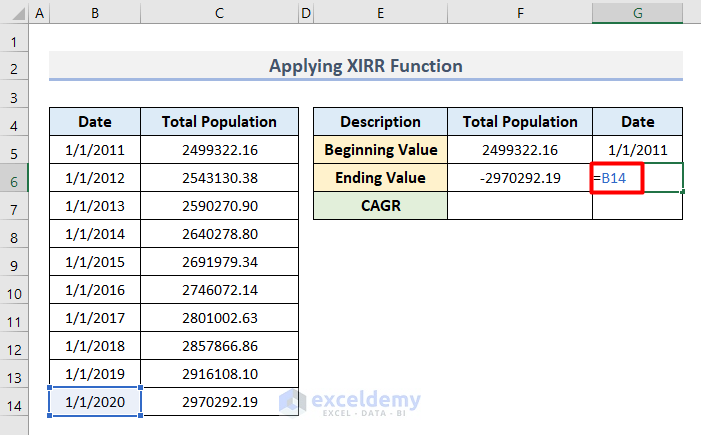
- We inserted our required beginning and ending values in the new table.
- Type this formula in cell F7.
=XIRR(F5:F6,G5:G6)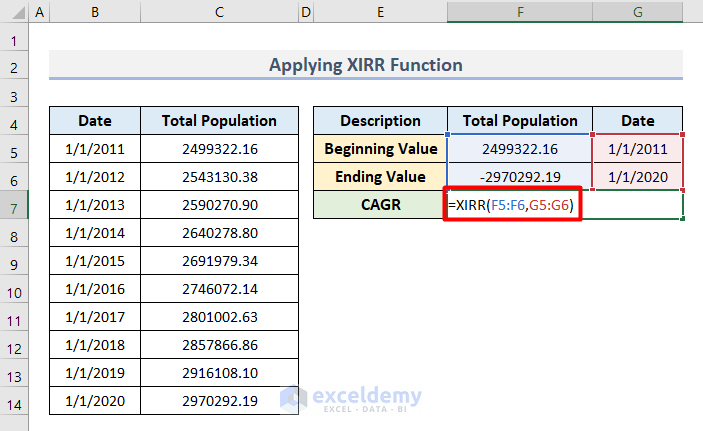
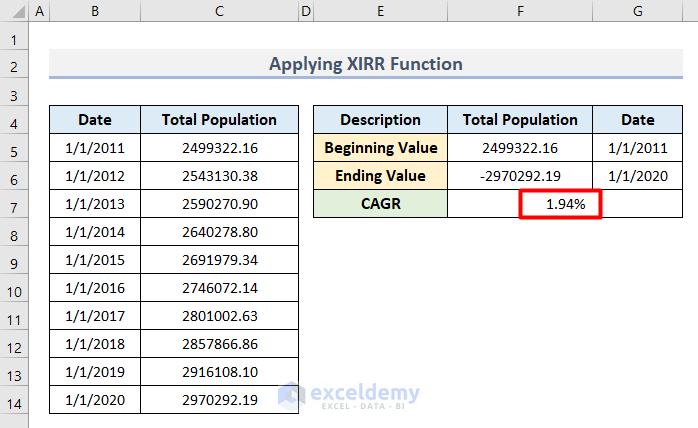
- Hit Enter.
- Get the CAGR for the required period.
Things to Remember
- Don’t forget to insert a Minus (–) sign before the cell reference of the Ending Value during the calculation with the XIRR function.
- Make sure to keep a similar format for each time value. It is also applicable to the population values.
Download Practice Workbook
You can download the worksheet to practice by yourself.
Related Articles
- How to Analyze Demographic Data in Excel
- How to Make a Population Pyramid in Excel
- How to Make Age Pyramid in Excel
- How to Create Age and Gender Chart in Excel
- How to Create Age Distribution Graph in Excel
- Population Projection Formula in Excel
<< Go Back to Excel Demographic Data | Excel for Statistics | Learn Excel
Get FREE Advanced Excel Exercises with Solutions!

