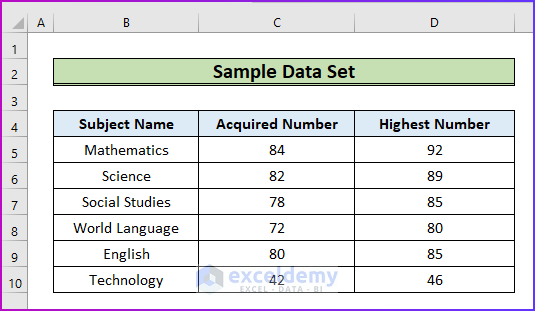
This is the sample dataset.
Method 1 – Paste the Excel Chart as an Enhanced Metafile Image
Steps:
- Select B4:D10 and go to the Insert tab.
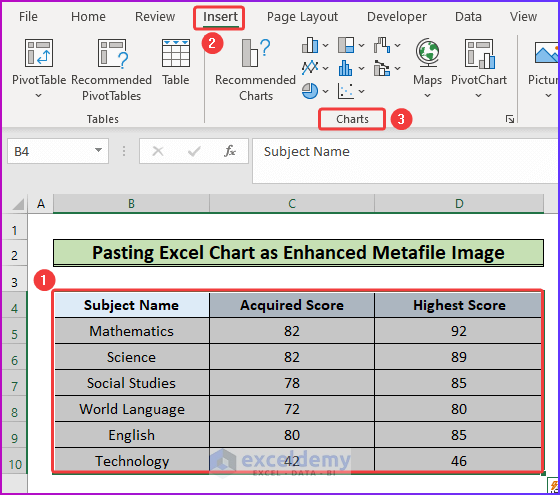
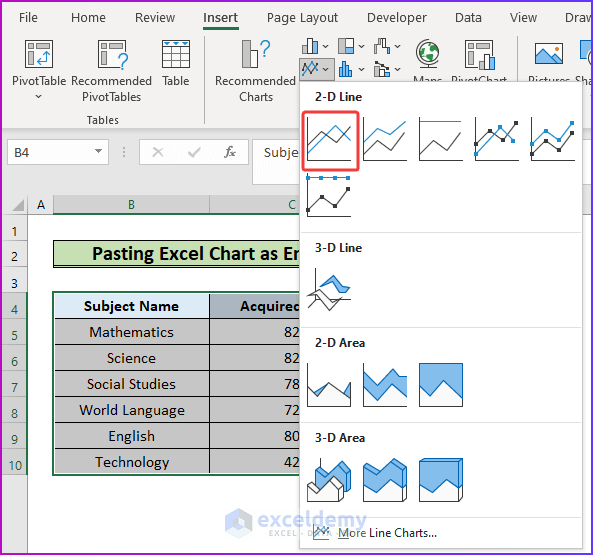
- In Charts, select 2-D Line.
- The chart will be displayed.
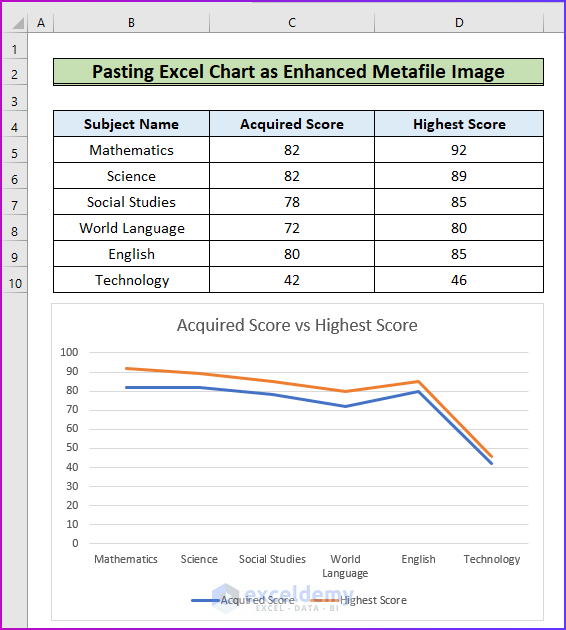
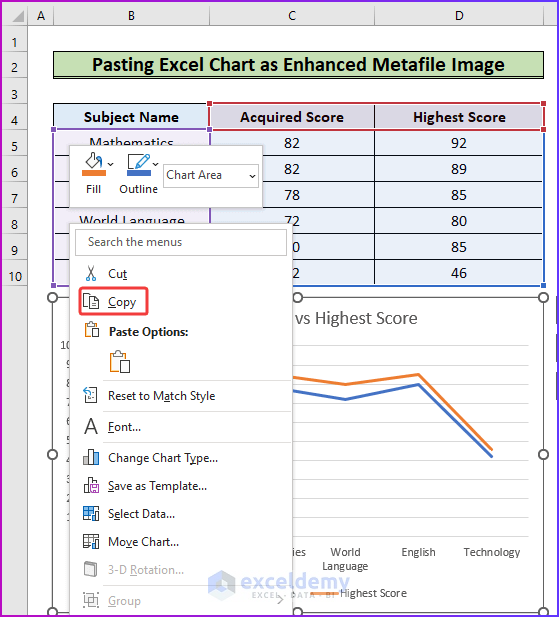
- Right-click the chart.
- Choose Copy or press Ctrl + C .
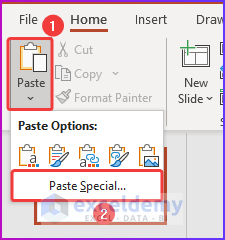
- Open the PowerPoint file and create a new slide.
- Click the downward arrow in Paste and choose Paste Special.
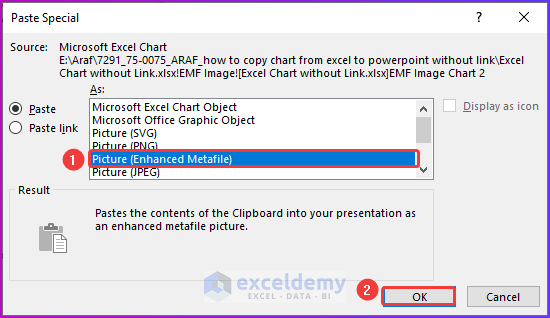
- In the Paste Special dialog box, paste the file as Picture (Enhanced Metafile) and click OK.
This is the output.

Read More: How to Perform Excel to PowerPoint Automation
Method 2 – Applying the Use Destination Theme & Embed Workbook Command
Steps:
- Create a chart following the steps described in the first method.
- Copy the chart.
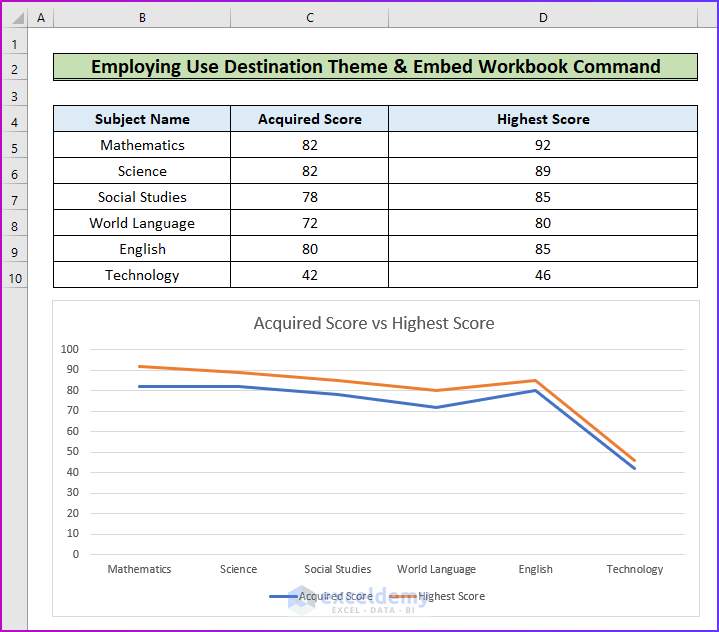
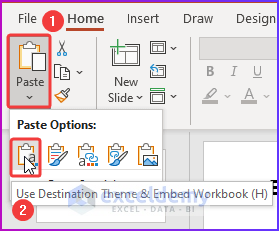
- Go to the PowerPoint slide and in Paste, choose Use Destination Theme and Enhance Workbook.
This is the output.

Read More: How to Insert Excel Chart into PowerPoint
Things to Remember
- To resize or redesign the chart, paste it as an enhanced metafile.
Download Practice Workbook
Download the free Excel workbook.
Related Articles
- Automatically Create PowerPoint Slides from Excel
- How to Insert an Excel File into PowerPoint as an Icon
- How to Update Charts in PowerPoint from Excel Automatically
- How to Copy Table from Excel to Powerpoint with Formatting
<< Go Back to Excel to PowerPoint | Export Data from Excel | Learn Excel
Get FREE Advanced Excel Exercises with Solutions!

