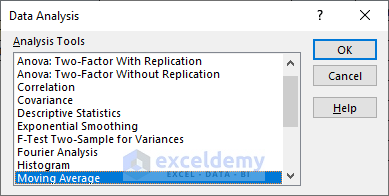
Method 1 – Analysis ToolPak
Description: The Analysis ToolPak is a collection of data analysis tools that provide advanced functions for statistical, financial, and engineering analyses. It adds various powerful functions to Excel, expanding its data manipulation and interpretation capabilities.
Usage: You can use the Analysis ToolPak to perform tasks such as regression analysis, correlation calculations, moving averages, t-tests, and more. It’s precious for users who need to conduct statistical analyses without requiring specialized software.
Method 2 – Solver Add-in
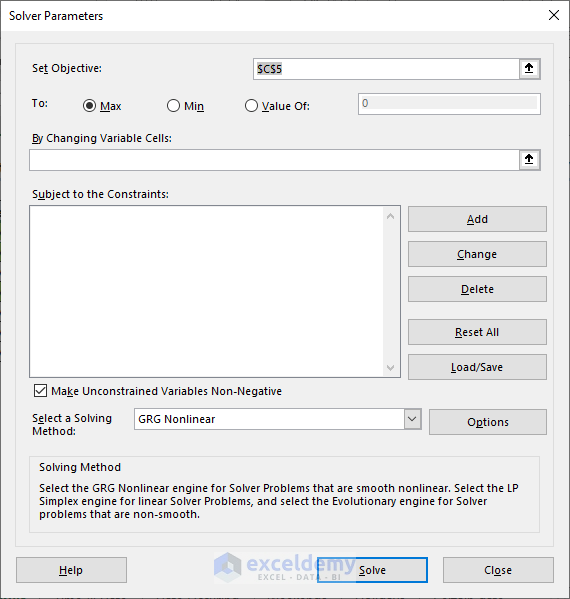
Description: The Solver Add-in is a powerful optimization tool that helps you find optimal solutions to problems that involve variables and constraints. It’s like having a virtual assistant that adjusts variables to achieve the best possible outcome while adhering to defined limitations.
Usage: Solver is commonly used for resource allocation, production scheduling, investment planning, and other scenarios where you must maximize or minimize a specific goal under certain conditions.
Method 3 – Power Pivot
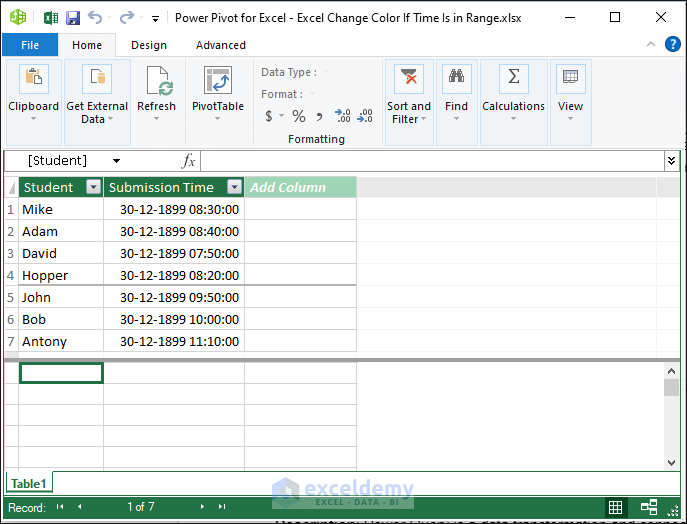
Description: Power Pivot is an advanced data modeling tool that empowers users to create data models, relationships between tables, and complex calculations. It’s an integral part of Excel and enables handling large datasets more efficiently.
Usage: Power Pivot is useful when dealing with substantial data volumes. It allows you to create robust data models, perform calculations with Data Analysis Expressions (DAX), and generate insights from interconnected data.
Method 4 – Power Query
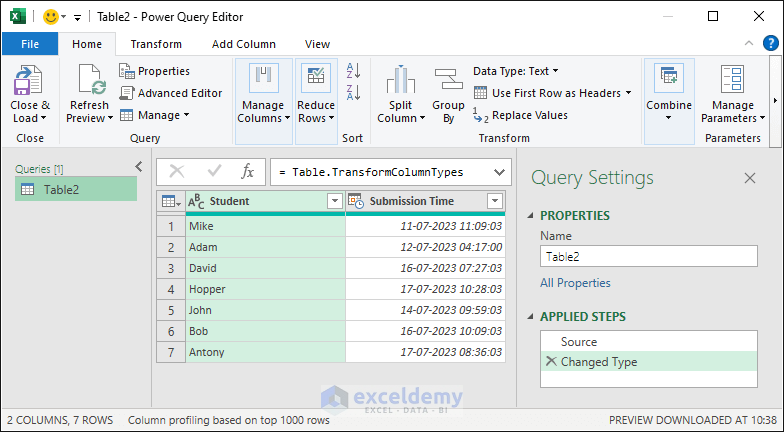
Description: Power Query is a data transformation and connection tool streamlining, importing, cleaning, and shaping data from various sources. It empowers users to perform data transformations without complex formulas.
Usage: Power Query is valuable for data preparation tasks, such as merging datasets, filtering rows, removing duplicates, and performing custom transformations before analysis.
Method 5 – Power View
Description: Power View is an interactive data visualization tool that enables users to create dynamic reports and dashboards using charts, tables, maps, and other visual elements. It enhances data storytelling by making data come alive.
Usage: Power View is ideal for creating engaging visual presentations of data trends, comparisons, and patterns. It allows users to explore data and gain insights interactively.
Method 6 – Power Map (3D Maps):
Description: Power Map, also known as 3D Maps in later versions of Excel, allows users to create 3D visualizations and geographic data analysis. It enables plotting data points on maps and visualizing changes over time.
Usage: A power Map is handy for geographical data analysis, showing trends, distributions, and correlations in a spatial context.
Method 7 – Inquire Add-in
Description: The Inquire Add-in provides advanced analysis tools for workbook inspection, comparison, and auditing. It helps you understand complex workbooks, detect errors, and manage workbook relationships.
Usage: Inquire helps review workbook structures, identify inconsistencies, and troubleshoot issues in complex Excel files. It’s particularly beneficial for maintaining data integrity and quality.
Method 8 – COM Add-ins
Description: COM (Component Object Model) Add-ins allow you to extend Excel’s functionality by integrating custom features or third-party applications. They enhance Excel’s capabilities and allow for seamless integration with other software.
Usage: COM Add-ins offer flexibility in tailoring Excel to your specific needs. They can be used to add specialized tools, automate processes, or integrate Excel with other software solutions.
Method 9 – XML Tools Add-in (Excel 2003 and Earlier)
Description: The XML Tools Add-in provided tools for working with XML data in older versions of Excel. It allowed users to import, export, and map XML data, facilitating data exchange between Excel and XML files.
Usage: XML Tools handled XML data, including importing and exporting XML files, mapping XML elements to Excel cells, and managing XML-related tasks.
How to Save Files as Excel Add-ins
You can customize your add-ins. All you need to do is store the VBA macro in a file and save it as an Excel Add-in.
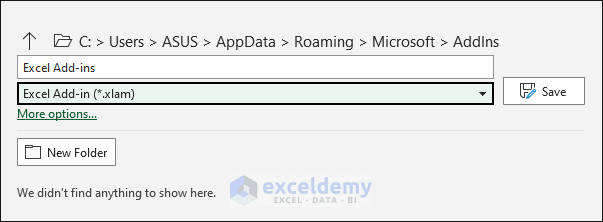
- Go to the File tab > Save as section.
- Select Excel Add-in (*.xlam) from the dropdown.
- Excel automatically selects the Add-in folder.
- Click Save.
Use a Different Location to Store Excel Add-ins
Usually, Excel stores the add-ins in its default folder. You can store the add-ins in a different folder.
- Click File tab > Options from the menu list.
- In the Excel Options window, go to the Trust Center section > click Trust Center Settings.

- In the Trust Center window, check whether the desired folder is in the list. If not, click Add new location.
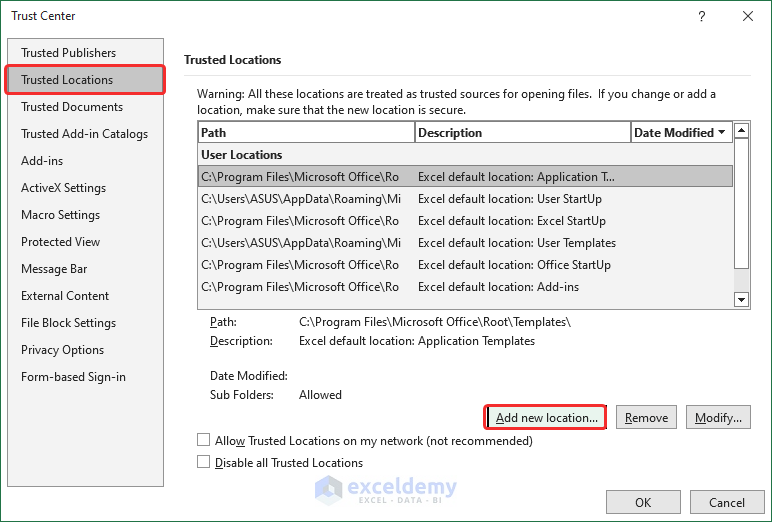
- In the Microsoft Office Trusted Location window, Browse the Path location.
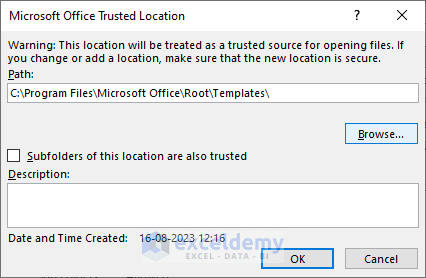
- Select the desired “Folder” and click OK.
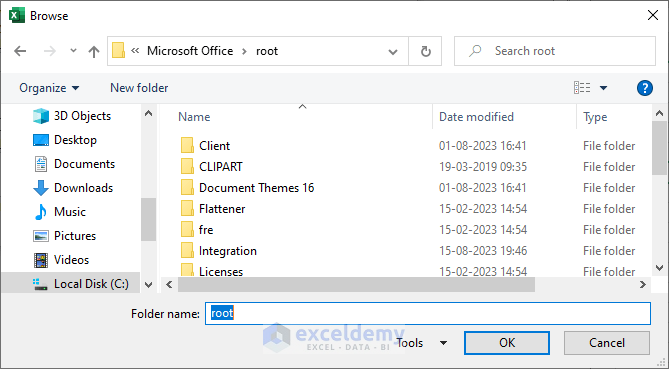
After selecting the folder, it will appear in the Microsoft Office Trusted Location window. Click OK to close the window.
Add-ins in Custom Tab Not Showing in Excel
If a custom tab you’ve created in Excel isn’t showing up as expected, there could be a few reasons for this issue.
- Check Excel Version Compatibility: Ensure that the custom tab and its associated add-ins are compatible with the version of Excel you’re using. Some features of add-ins might not work across all versions.
- Make sure you activated the Add-ins
- Check for Ribbon Customization: A custom tab might be created but not displayed by default. To check and customize the ribbon:
- In the Excel Options window, select “Customize the Ribbon” from the left-hand menu.
- On the right side, you’ll see a list of tabs. Ensure that your custom tab is checked. If it’s not, check the box next to it.
- Reset Ribbon Customization: If you’ve customized the ribbon in the past, there might be conflicts preventing your custom tab from appearing. To reset the ribbon to its default state:
- In the Customize the Ribbon section, click the “Reset” button at the bottom.
- Choose “Reset all customizations” to reset the ribbon completely. This will remove all custom tabs, so back up any customizations you want to keep.
- Check for Conflicting Add-Ins: Conflicts between different add-ins can cause issues with tab visibility. Try disabling other add-ins temporarily to see if your custom tab appears.
By following these steps, you should be able to identify and resolve the issue with your custom tab not showing in Excel.
Advantages of Using Excel Add-ins
Here are some key advantages of using Excel add-ins:
- Extended Functionality: Add-ins expand Excel’s native features, allowing you to perform specialized tasks, complex calculations, and advanced analyses that wouldn’t be feasible using only built-in functions.
- Efficiency and Time Savings: Add-ins automate repetitive tasks, reducing manual effort and saving time. They eliminate the need for manual calculations and provide quick solutions to complex problems.
- Data Analysis and Insights: Many add-ins offer specialized data analysis tools, enabling you to derive deeper insights from your data. These tools often include advanced statistical analysis, data visualization, and reporting capabilities.
- Customization: Add-ins allow you to customize Excel to fit your specific needs. You can add features that align with your work requirements, tailoring Excel to become a more personalized and efficient tool.
- Data Cleansing and Transformation: Add-ins like Power Query simplify data preparation by providing tools for data cleansing, transformation, and consolidation. This ensures your data is clean, accurate, and ready for analysis.
- Visualization: Visualization add-ins help you create compelling charts, graphs, dashboards, and maps to communicate your data effectively.
- Automation: Automation add-ins, macros, and scripting tools enable you to automate repetitive tasks and processes, reducing the risk of errors and improving efficiency.
- Collaboration: Collaboration-focused add-ins enhance team collaboration by enabling real-time co-authoring, version control, and communication within Excel.
- Ease of Use: Add-ins often come with user-friendly interfaces and intuitive tools that make complex tasks more accessible to a broader range of users, regardless of their technical expertise.
- Specialized Solutions: Some add-ins address specific industries or domains, providing tailored solutions that cater to unique needs. This ensures that professionals in various fields have the tools they require.
- Stay Current: Add-ins can offer the latest advancements and features even if your Excel version is less recent. This keeps you up-to-date with the latest trends in data analysis and visualization.
Frequently Asked Questions
1. Are built-in add-ins the same as external add-ins?
Ans: No, built-in add-ins are pre-installed by Microsoft and come with Excel. External add-ins, on the other hand, are developed by third parties and need to be installed separately.
2. Can I install additional add-ins in Excel?
Ans: Yes, you can install third-party add-ins to enhance Excel’s capabilities. They might provide features for specific tasks like data visualization, data cleaning, and more.
3. Are there security concerns with using third-party add-ins?
Ans: While third-party add-ins can offer valuable functionalities, it’s important to download them from trusted sources to mitigate potential security risks.
4. What’s the benefit of using built-in add-ins?
Ans: Built-in add-ins are readily available and don’t require extra installation. They seamlessly integrate into Excel, providing consistent user experiences.
Things to Remember
- Save the file using Excel’s “Add-in” extension to ensure compatibility and proper functionality.
- Exercise caution when selecting add-ins for insertion. Navigate the “Add-ins” window carefully to choose the desired ones.
- Remember that you can uninstall unnecessary add-ins whenever needed, offering flexibility in managing your Excel environment.
Excel Add-ins: Knowledge Hub
<< Go Back to Learn Excel
Get FREE Advanced Excel Exercises with Solutions!

