Method 1 – Open Excel File and Select Grid Lines
- Open the Excel file.
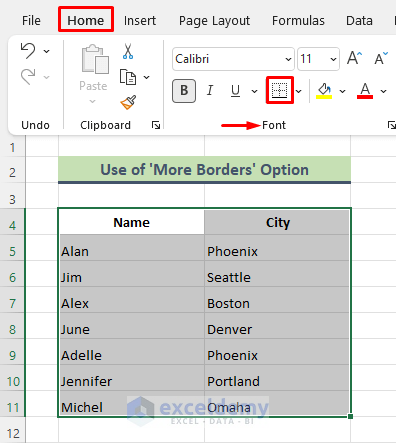
- Select the dataset where you want to get bold gridlines.
- From Excel Ribbon, go to Home > Borders icon (under the Font group).
⏩ Note:
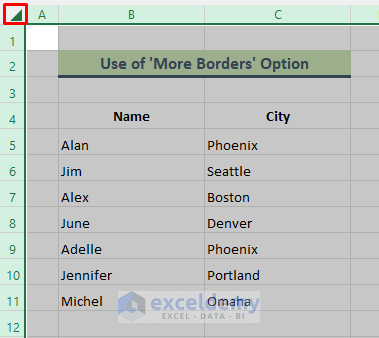
If you want to make all the gridlines bold, click on the triangle icon at the intersection of the column and row index. The entire worksheet will be selected.
Method 2 – Use the ‘More Borders’ Option to Make Grid Lines Bold
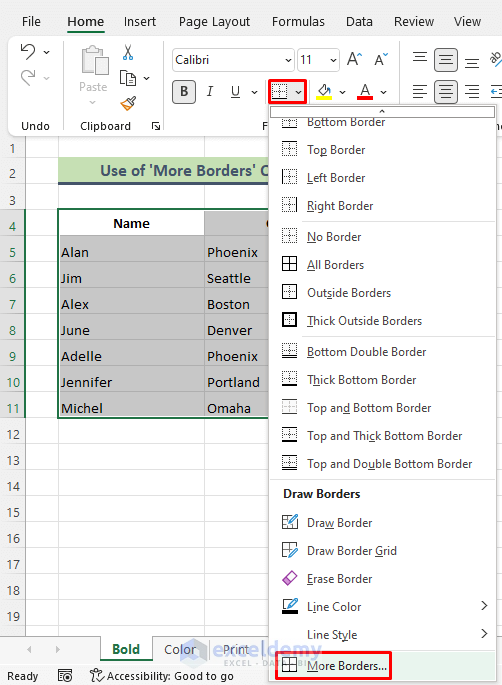
- Click on the Borders drop-down and select More Borders.
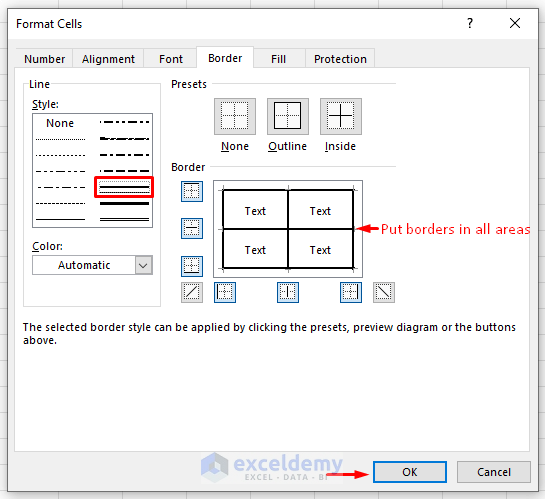
- The Format Cells dialog will appear.
- Go to the Line section and choose a thicker line.
- Go to the Border section and put borders on all sides.
- Click OK to close the dialog.
Method 3 – Review the Changes
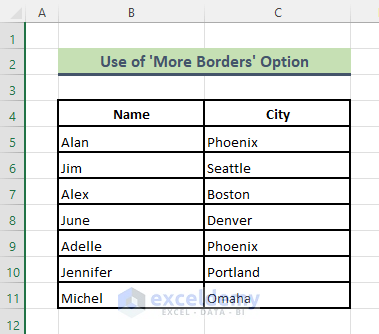
- Upon pressing OK, we can see that all the grid lines in the selected dataset are converted to bold style.
- From the below output, we can say that bold grid lines made the dataset more distinguishable.
Change Color of Grid Lines Using Excel Options Feature.
Steps:
- Open an Excel sheet (say Sheet1) where you want to change the color gridlines and go to the File tab from the ribbon.
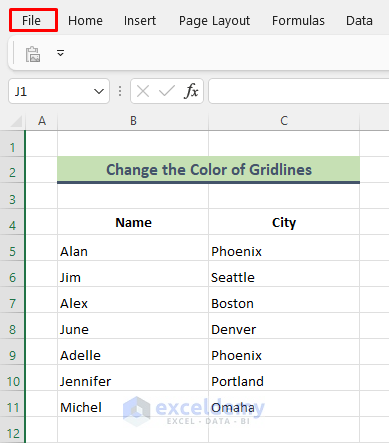
- Click on Options.

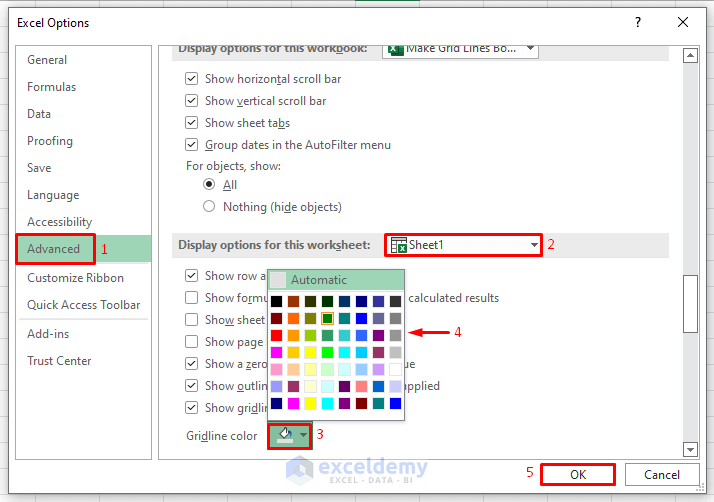
- The Excel Options dialog shows up. Then, select the Advanced option, go to the Display options for the worksheet section, and choose the worksheet.
- Click on the Gridline color icon and choose the color. Press OK.
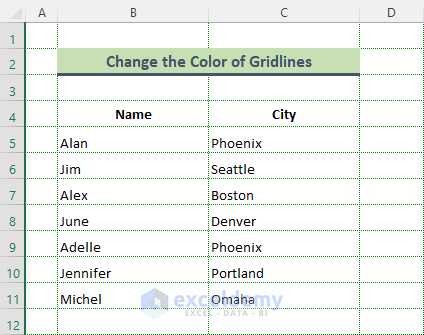
- Get the below result. The color of the entire worksheet has become green.
Print Excel Grid Lines
Steps:
- Go to the specific worksheet.
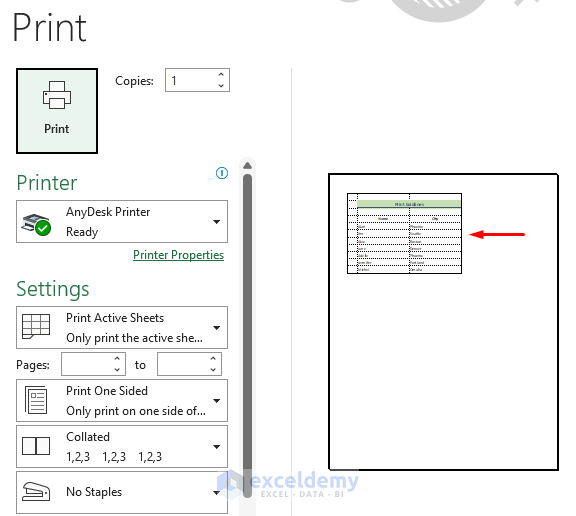
- Select the Page Layout tab, go to the Sheet Options, and put a checkmark on the Print option under Gridlines.

- Press Ctrl + P and get gridlines in the print.
Download Practice Workbook
You can download the practice workbook that we have used to prepare this article.
Related Article
<< Go Back to Edit Gridlines | Gridlines | Learn Excel


