What Is a Salary Increase Matrix?
- A salary increase matrix, also known as a merit increase matrix or merit matrix, is a mathematical grid used by compensation specialists to help business managers determine precise and effective salary raises for an organization’s employees.
- It provides a structured approach for allocating salary increases based on specific criteria.
- There are two main types of salary increase matrices:
- Standard Salary Increase Matrix: This matrix considers only employee performance when determining salary raises.
- Two-Variable Salary Increase Matrix: In this system, both employee performance and compa-ratio are taken into account.
Two Variable Salary Increase Matrix
- Let’s focus on the Two-Variable Salary Increase Matrix since it’s currently more popular.
- This matrix relies on two key factors:
- Employee Performance: Employees are typically categorized into five levels, ranging from 1 (lowest performer) to 5 (best performer).
- Compa-Ratio: The compa-ratio measures the relationship between an employee’s current salary and the market average, expressed as a percentage.
- The formula for compa-ratio is:
Compa ratio= (Current Salary/ Market Average) * 100
- Matrix Structure:
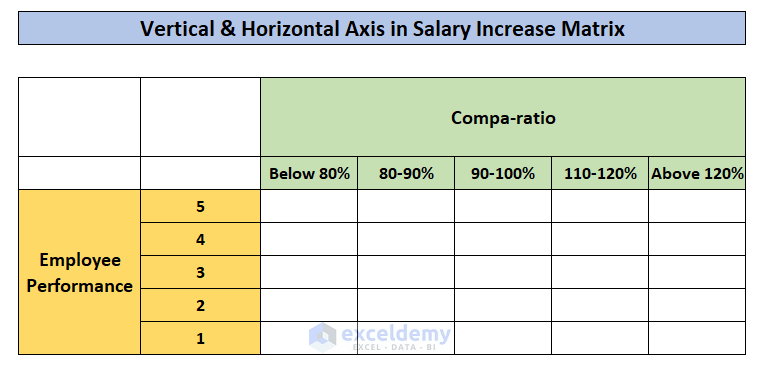
- The salary increase matrix is represented as a grid with two axes:
- Vertical Axis: Represents the different levels of employee performance (e.g., 1 to 5).
- Horizontal Axis: Represents the compa-ratio values (expressed as percentages).
- Each cell in the matrix corresponds to a specific combination of employee performance level and compa-ratio.
- The salary increase matrix is represented as a grid with two axes:
See the figure below.
- Cell Values:
- The values in each cell indicate the appropriate salary increase percentage based on the employee’s performance level and compa-ratio.
- By populating the matrix cells, we ensure that every value is dependent on the anchor cell (usually the highest performer at market average).
Let’s break down the process of creating a salary increase matrix, focusing on establishing relationships between cells and determining values based on an anchor point.
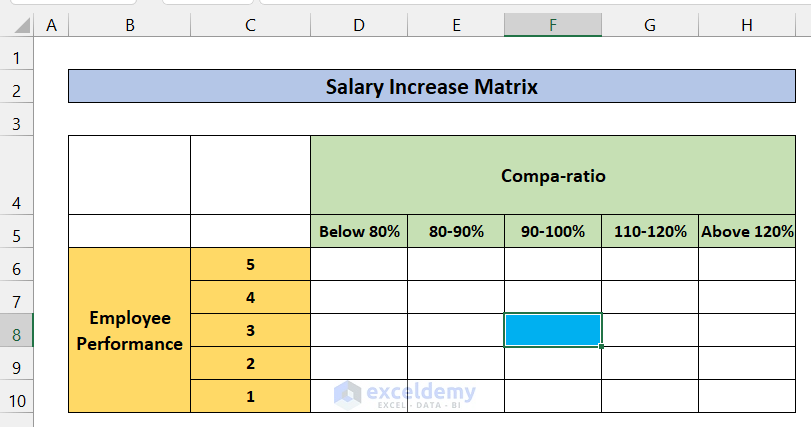
Step 1 – Select the Anchor Cell
- The anchor cell serves as the reference point for calculating values in all other cells.
- For convenience, we’ll choose the cell located in the middle of the matrix.
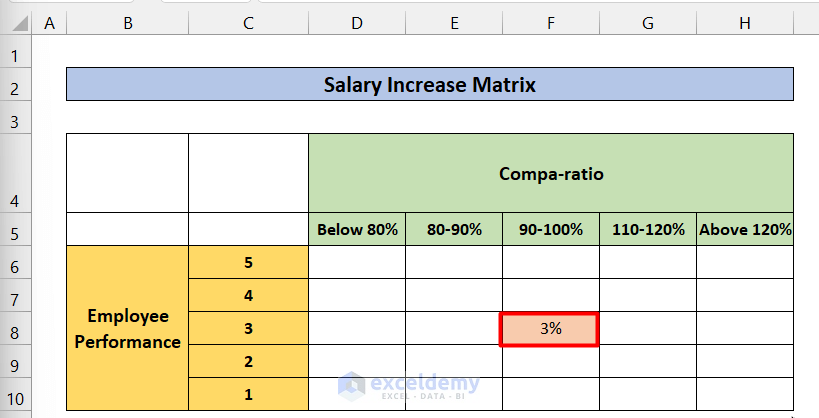
- Let’s say this cell corresponds to a compa-ratio of 90% to 100% and an Employee Performance level of 3.
- We’ll insert the percentage increase in salary for this anchor cell. For demonstration purposes, let’s assume a 3% increase.
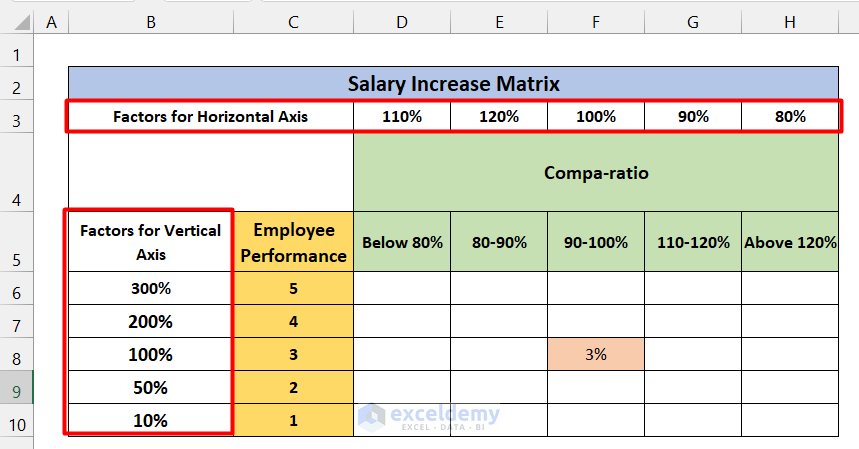
Step 2 – Setting Weightage Factors for Horizontal & Vertical Scales
- We need to determine values for the other cells relative to the anchor cell (let’s call it cell F8).
- To do this, we establish relationships based on weightage factors:
- Employee Performance Weightage:
- We generally want to give a higher raise to a level 5 performer than to a level 1 performer.
- As a result, level 5 will have a higher weightage factor, gradually decreasing from level 4 to level 1.
- Compa-Ratio Weightage:
- An employee who is underpaid compared to the current market (compa-ratio of 90% or less) deserves a more significant raise.
- Those who are already paid well (compa-ratio of 100% or more) receive smaller raises.
- Based on these considerations, we assign dummy weightage percentages for each axis.
- Employee Performance Weightage:
Step 3 – Application of Formula in the Cells
- In your spreadsheet, navigate to cell D3.
- Enter the following formula:
=$F$8*$B6*D$3-
- Here’s what each part of the formula represents:
- $F$8: The anchor value (from cell F8).
- $B6: The vertical weightage factor (from cell B6).
- D$3: The horizontal weightage factor (from cell D3).
- By locking the cell references properly (using $), we ensure that we can copy this formula to other cells.
- Here’s what each part of the formula represents:
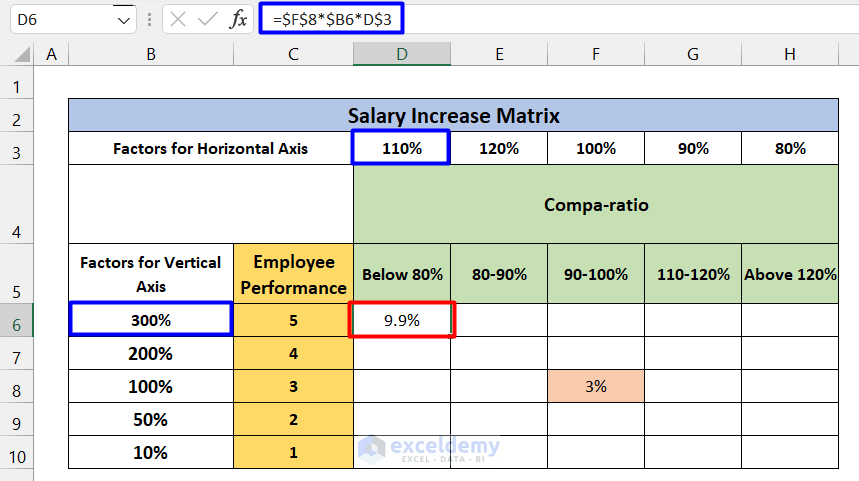
- After applying the formula, you should have the calculated results in cell D3.
- Use the Fill Handle to autofill the formula in other cells within the matrix.
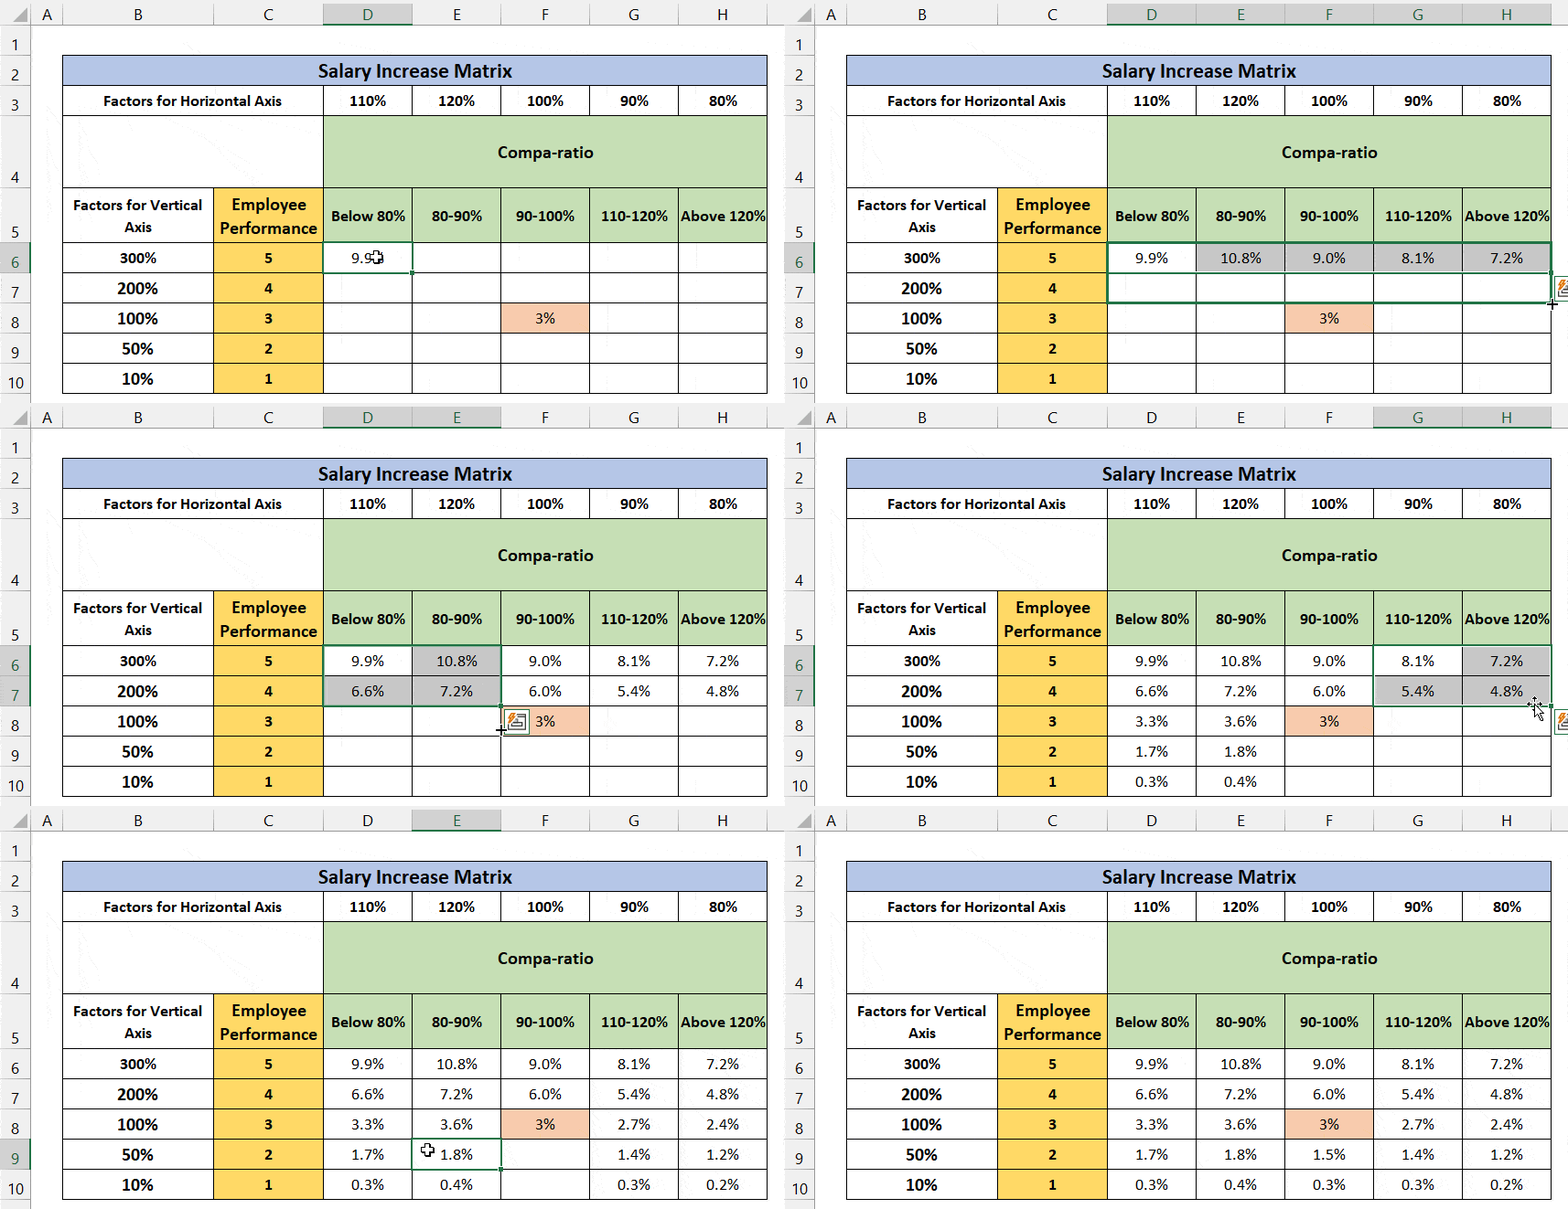
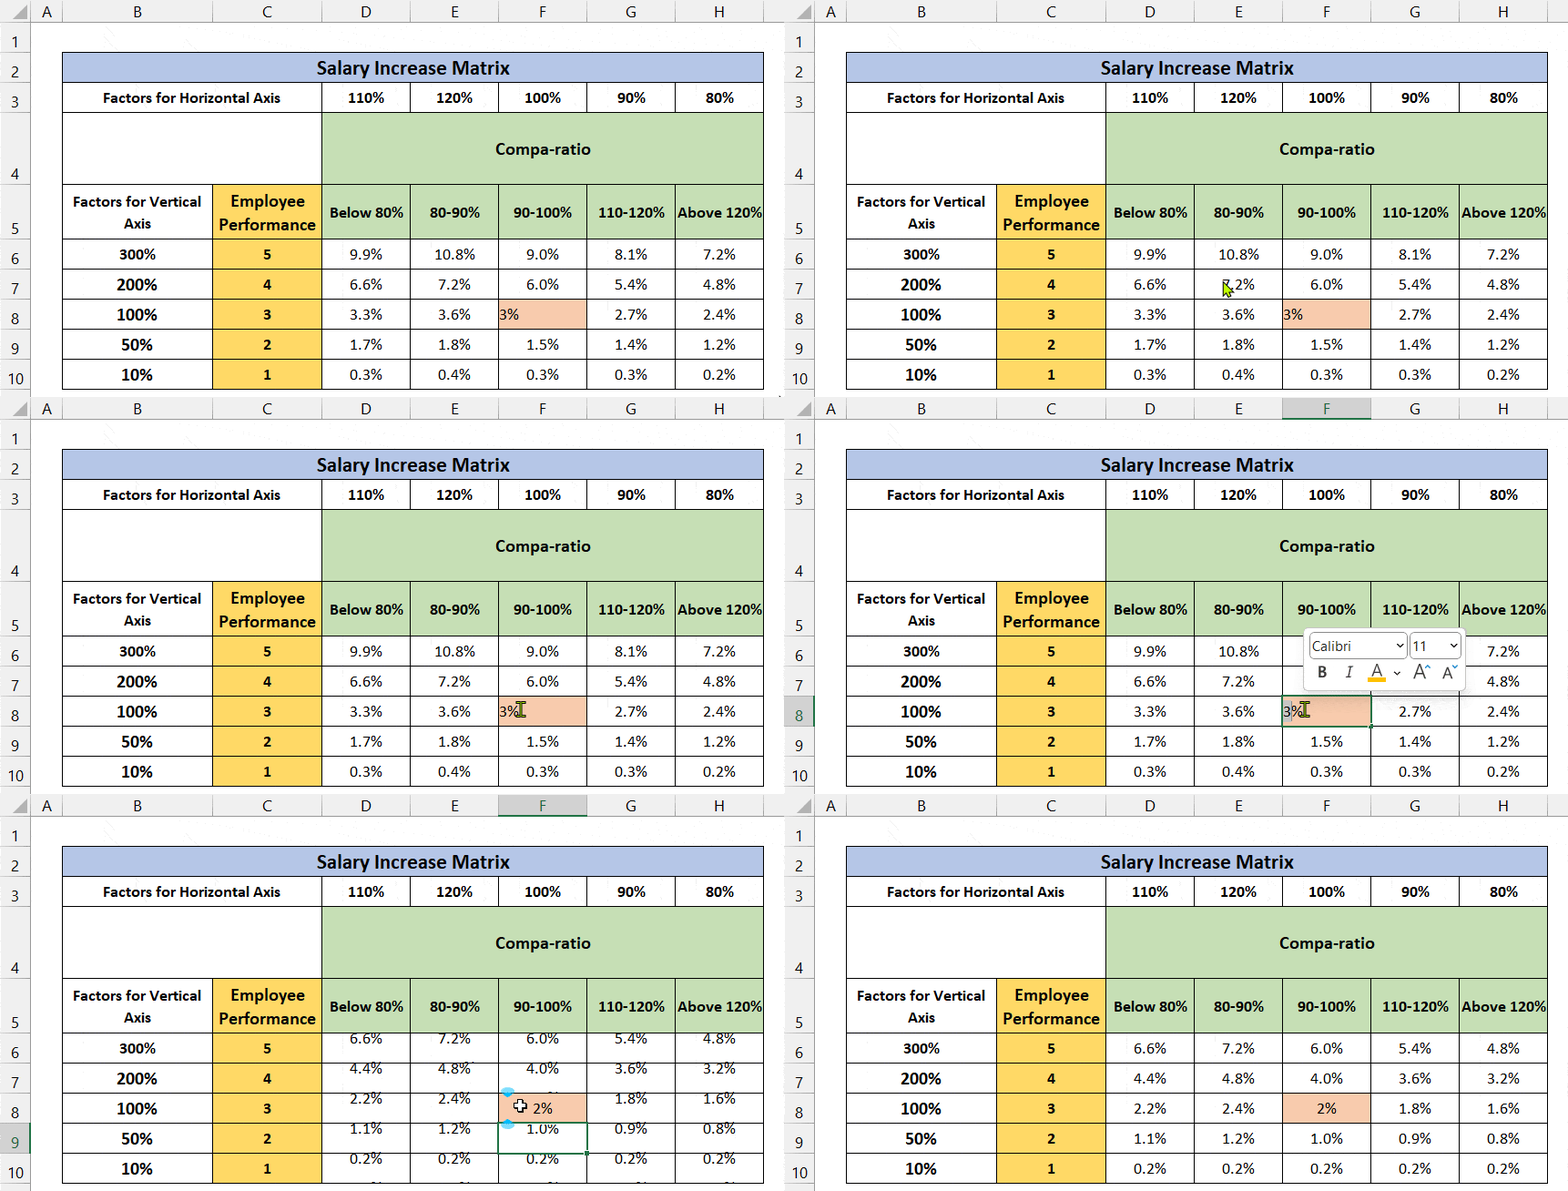
- Now, all cell values are connected to the anchor value. If you change the value in F9 (the anchor), all other cell values will adjust accordingly.
Step 4 – Using the Salary Increase Matrix to Calculate Salary
- Suppose you have a list of employees with their IDs, Employee Performance, Compa Ratio, and basic salary (as shown in the figure below).
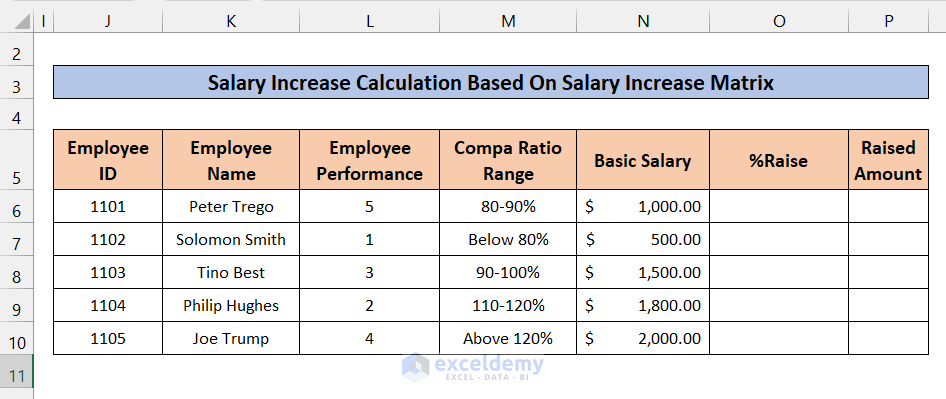
- To determine the percentage raise for each employee, we’ll find the corresponding value in the Salary Matrix based on their Employee Performance and Compa-Ratio.
- Apply the following formula in a cell (let’s say cell N6). This formula uses the INDEX and MATCH functions:
=INDEX($D$6:$H$10,MATCH($L6,$C$6:$C$10,0),MATCH($M6,$D$5:$H$5,0))How Does the Formula Work?
- MATCH($M6,$D$5:$H$5,0): Searches the Compa Range (M6) in the matrix’s horizontal axis (Compa Ratio in cells D5:H5) and returns the column number.
- MATCH($L6,$C$6:$C$10,0): Searches the Employee Performance (L6) in the matrix’s vertical axis (Employee Performance in cells C6:C10) and returns the row number.
- INDEX($D$6:$H$10,MATCH($L6,$C$6:$C$10,0),MATCH($M6,$D$5:$H$5,0)): Retrieves the value from the cell of the array D6:H10 corresponding to the row and column numbers obtained from the two MATCH functions.
- You should now have the calculated results for each employee’s salary raise based on the Salary Increase Matrix.

- Calculate the Raised Amount: To determine the raised amount, multiply the percentage raise by the basic salary. You can use the following formula:
For example, if the basic salary is in cell N6 and the percentage raise is in cell O6, the formula would be =$N6*$O6.
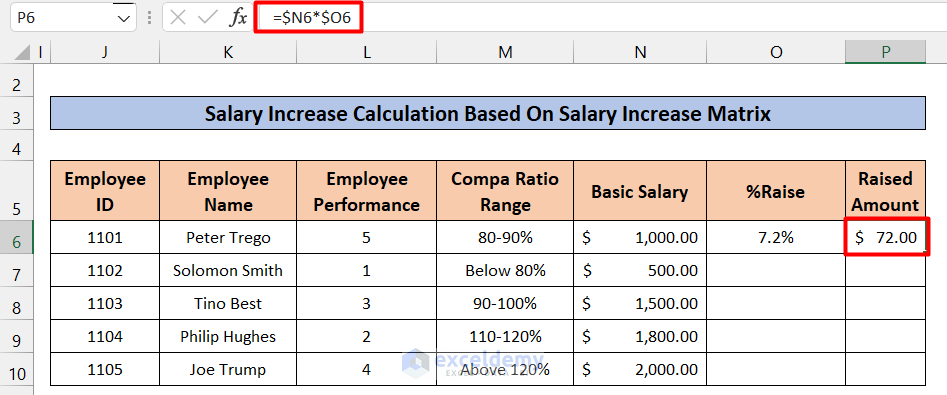
- Using the Fill Handle: After calculating the raised amount for one cell, you can use the Fill Handle to copy the formula to other cells in the same column. This will automatically adjust the references and calculate the raised amounts for all employees.
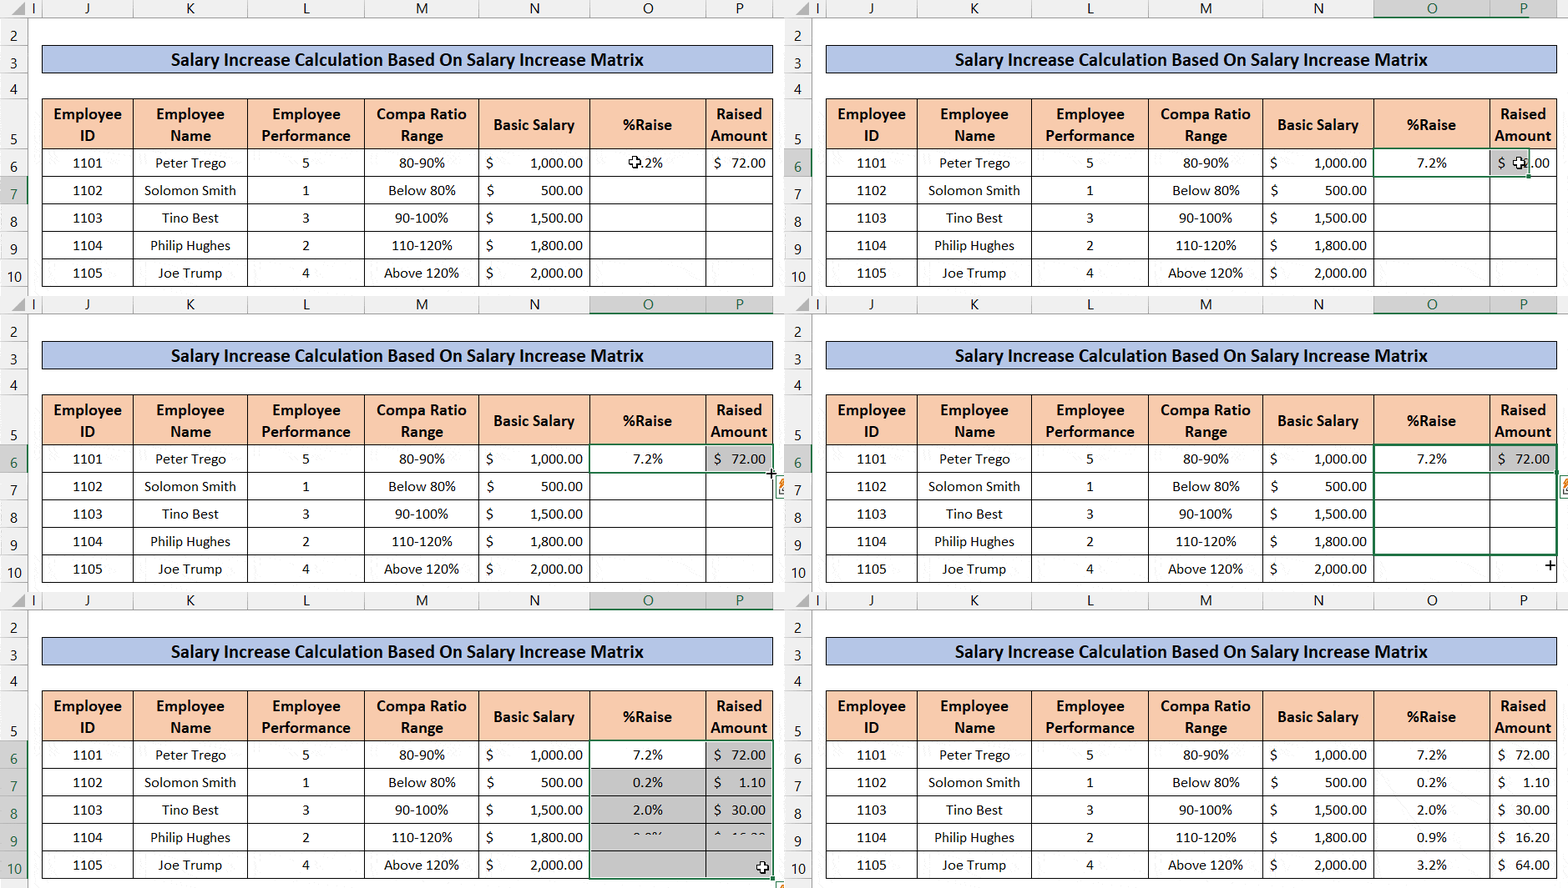
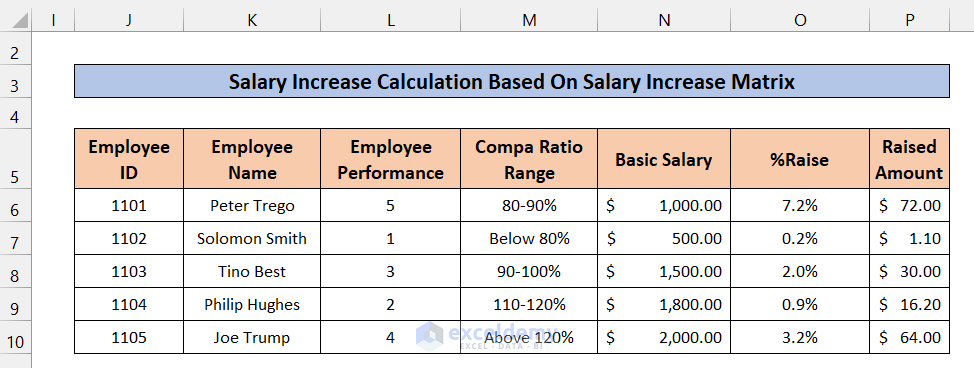
- Final Result: Once you’ve filled in the formula for all employees, your spreadsheet should display the raised amounts based on their individual basic salaries and percentage raises.
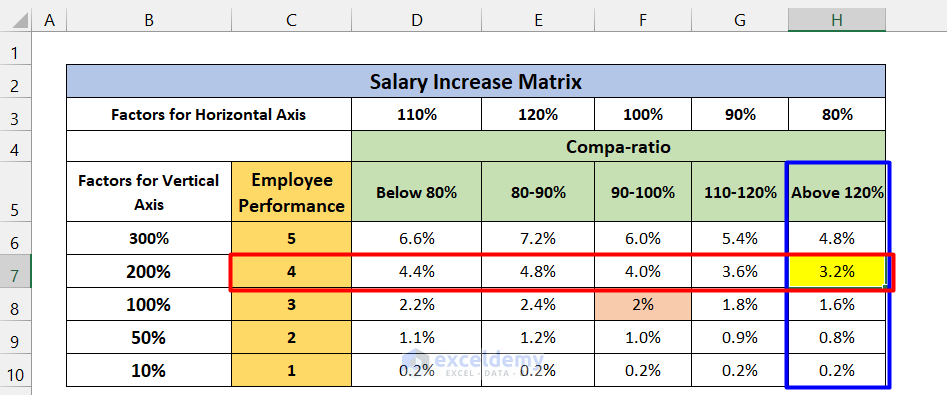
- Verification: To verify the calculation, let’s take an example. Consider Joe Trump, with Employee ID 1105, an Employee Performance Rating of 4, and a Compa Ratio above 120%. According to the matrix, Joe’s percentage raise is 3.2%.
Things to Remember
- You can adjust the anchor point (cell references) as needed.
- Weightage factors can also be customized based on your requirements.
Download Practice Workbook
You can download the practice workbook from here:
l<< Go Back to Salary | Formula List | Learn Excel
Get FREE Advanced Excel Exercises with Solutions!

