In this article, we will demonstrate 6 easy ways to save an Excel chart as a high resolution image.
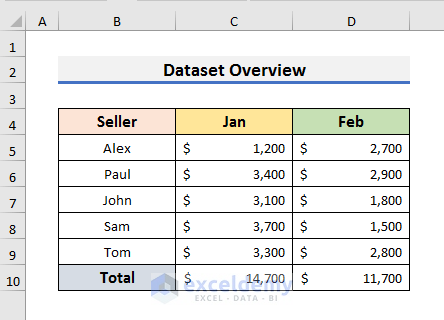
To illustrate the methods, we will use the dataset below that contains information on the sales amounts of some sellers over 2 months. We will plot the sales amounts on an Excel chart and save it as a high resolution image.
After plotting, the Sales Chart will look like the picture below.

Method 1 – Using the Context Menu
In Excel 365, we can use the Context Menu to save the chart as a high resolution image.
Steps:
- Right-click on the top corner of the chart to open the Context Menu.
- Select Save as Picture.
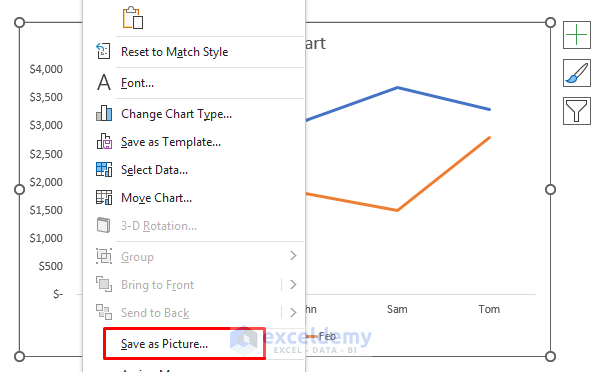
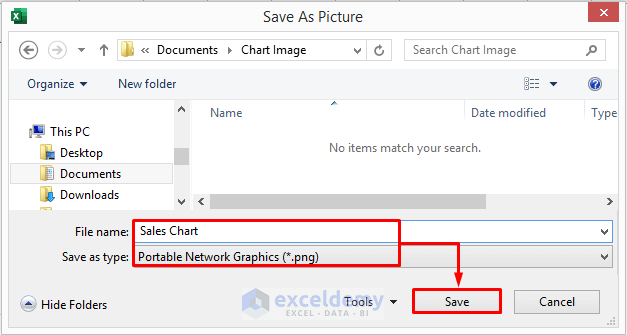
This will open the Save As Picture dialog box.
- Select a folder to save the chart.
- Enter a name in the File name field and select Portable Network Graphics (*.png) in the Save as type field.
- Click on Save to proceed.
The saved image will appear in the desired folder.
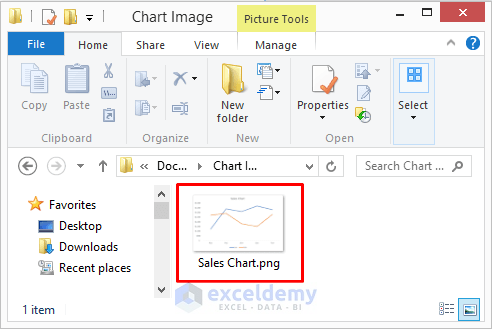
Note: The size of the image will be the same as the chart. Change the size of the chart before opening the Context Menu.
Read More: Save Excel Table as Image with High Resolution
Method 2 – Using Microsoft PowerPoint or Word
We can also use Microsoft PowerPoint or Word to save an Excel chart as a high resolution image. We’ll have to copy the excel chart and paste it into these applications. This process is effective only when a small number of charts need to be saved.
Steps:
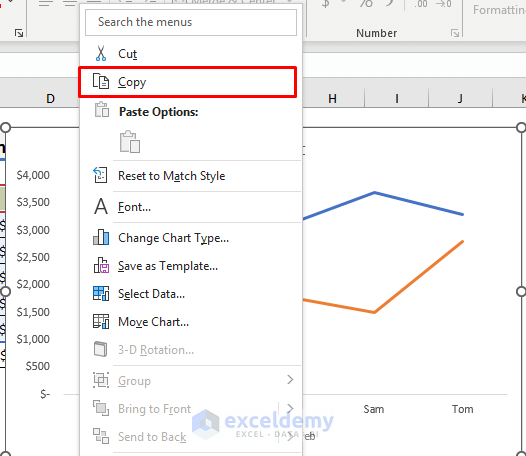
- Right-click on the top corner of the chart to open the Context Menu.
- Select Copy.
- Alternatively, click on the chart and press Ctrl + C to copy it.
- Open Microsoft PowerPoint or Word. Here we’ll use Microsoft PowerPoint.
- After opening PowerPoint, a blank slide is presented.

- Right-click on the slide to open the Context Menu.
- Select the Paste Images option.
- Alternatively, press Ctrl + V to paste the image.
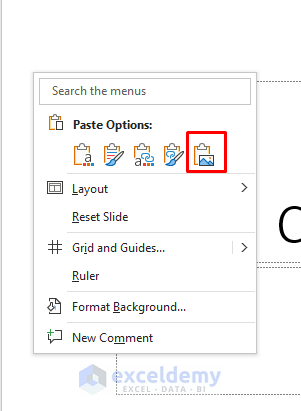
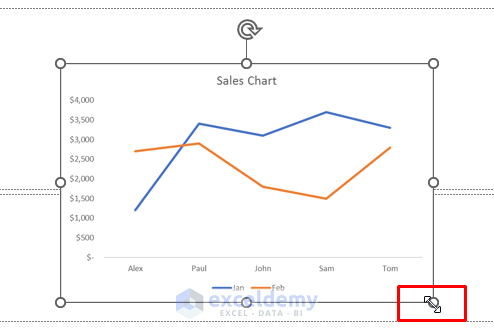
The chart is pasted into the slide.
- Resize it using the Double Header Arrow.
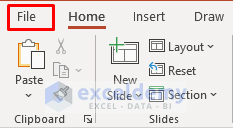
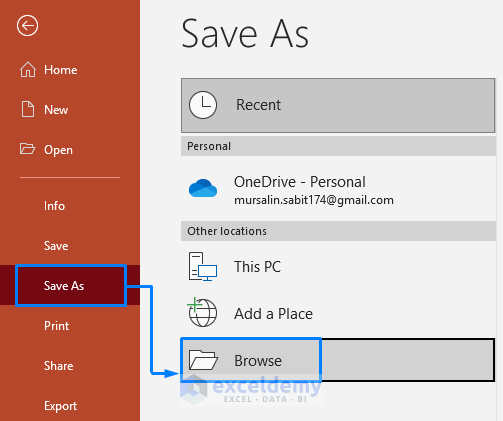
- Click on the File tab.
- Select Save As.
- In the Save As dialog box that opens, click on Browse.
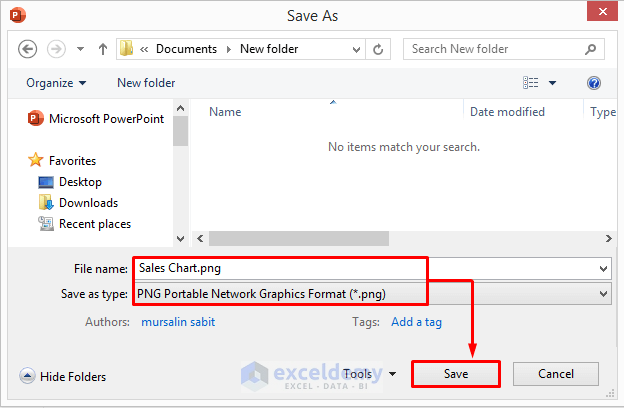
- Select a folder to save the chart.
- Enter a name in the File name field and select PNG Portable Network Graphics Format (*.png) in the Save as type field.
- Click on Save to proceed.
A Microsoft warning message will appear.
- Click on Just This One.

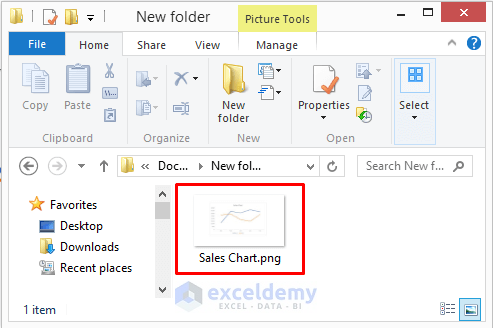
The image is saved in the desired folder.
Method 3 – Using Microsoft Paint
This process is similar to the previous one, but we’ll use Microsoft Paint instead of PowerPoint.
Steps:
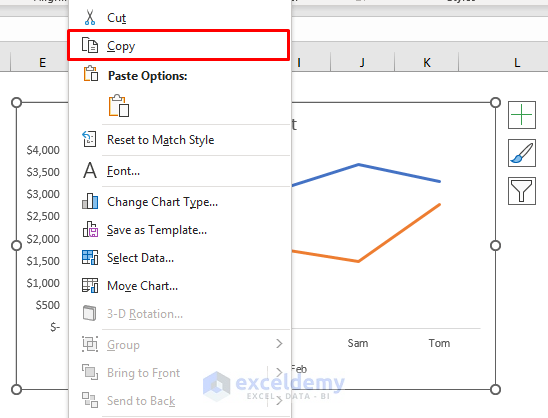
- Right-click on the top corner of the chart to open the Context Menu.
- Select Copy.
- Alternatively, select the chart and press Ctrl + C to copy it.
- Open the Microsoft Paint application.
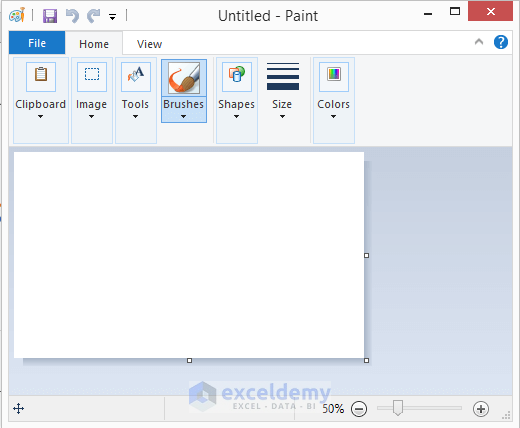
- Press Ctrl + V to paste the chart.
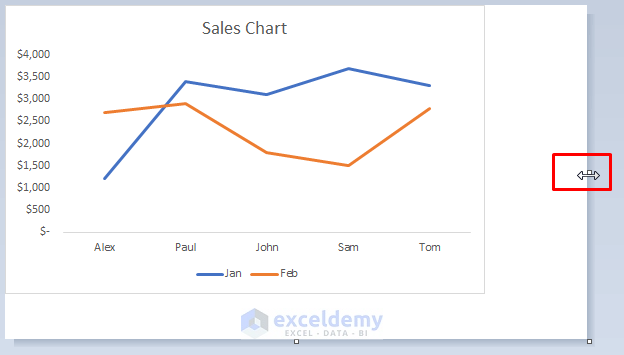
- Resize it to remove the blank space.
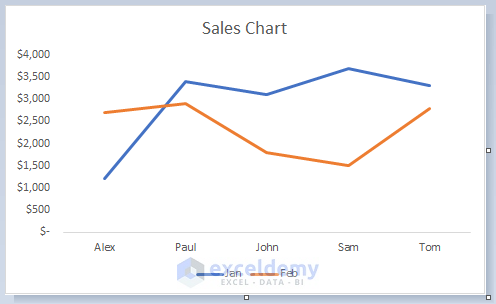
After resizing, the image will look like the picture below.
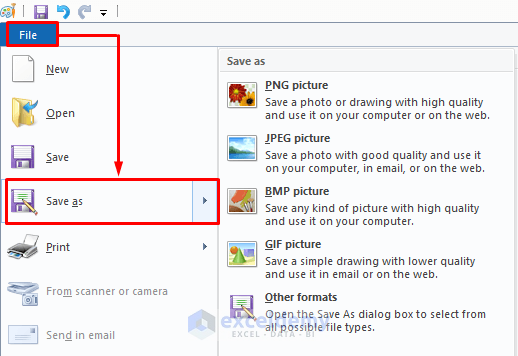
- Select the File tab and click on the arrow icon of the ‘Save as’ option.
- Select the PNG picture format.
- Select a folder to save the chart.
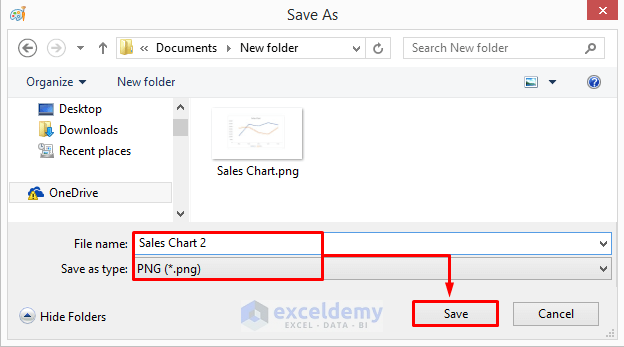
- Enter a name in the File name field and select PNG (*.png) in the Save as type field.
- Click on Save to proceed.
Method 4 – Saving Excel File as PDF
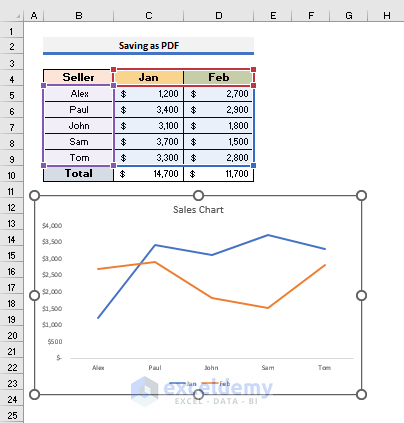
You can also save a chart as a high resolution image by saving the excel file as a PDF. This method is not recommended because other information is stored with the image in the PDF file.
Steps:
- Drag the chart down just below the dataset.
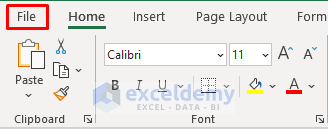
- Click on the File tab.
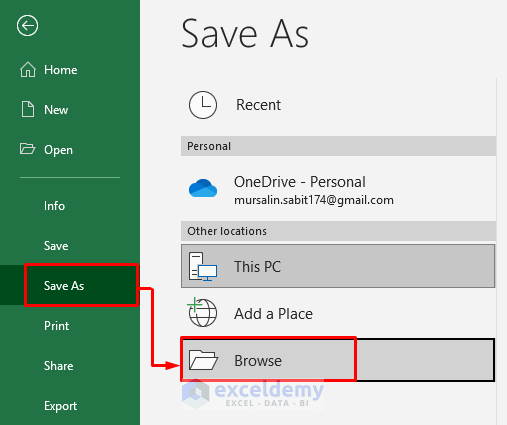
- Select Save As then click on Browse.
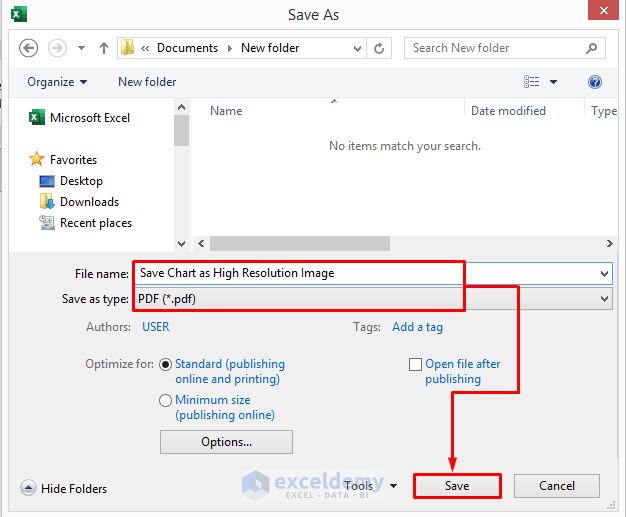
- Select a folder to save the chart in the Save As dialog box that opens.
- Enter a name in the File name field and select PDF (*.pdf) in the Save as type field.
- Click on Save to proceed.
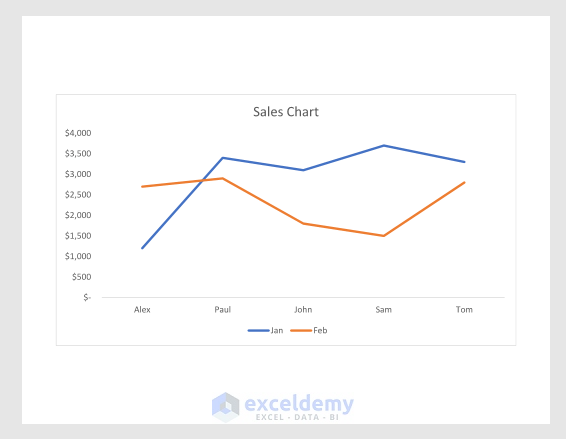
The chart will be saved as a pdf file in the specified location.
If you open the PDF file, you will see the chart in it.
Method 5 – Saving as Web Page
If you have lots of charts in your excel file, then you can save the Excel file as a web page. This will create a folder in the specified location and save all the charts as PNG images in that folder.
Steps:
- Click on the File tab.
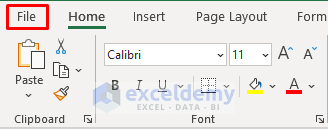
- Click on Save As and select Browse.
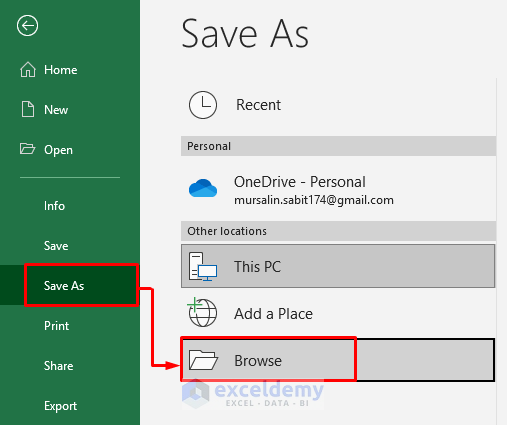
- In the Save As dialog box that opens, select a folder to save the chart.
- Enter a name in the File name field and select Web Page (*.htm;*html) in the Save as type field.
- Click on Save to proceed.
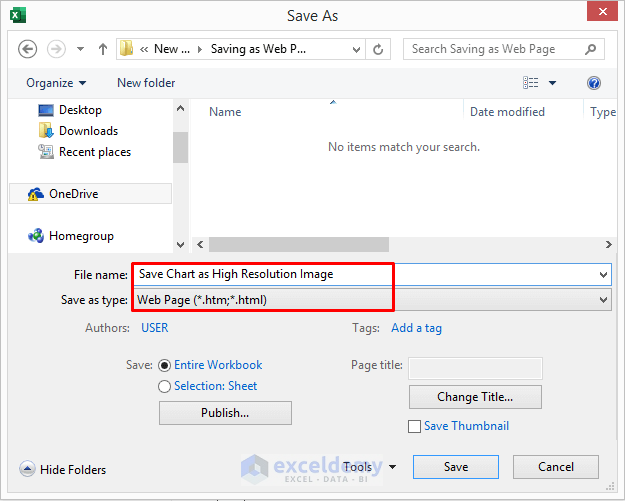
A warning message will appear.
- Select Yes.

In the specified location are one folder and a .htm file.
- Open the folder.
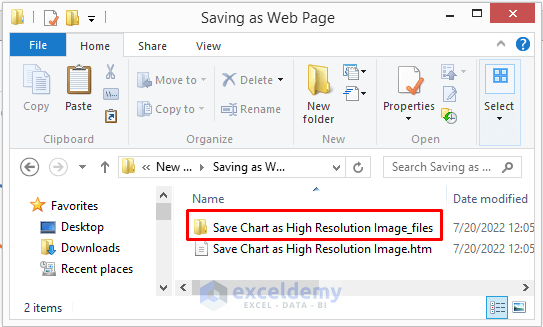
All the images are displayed.
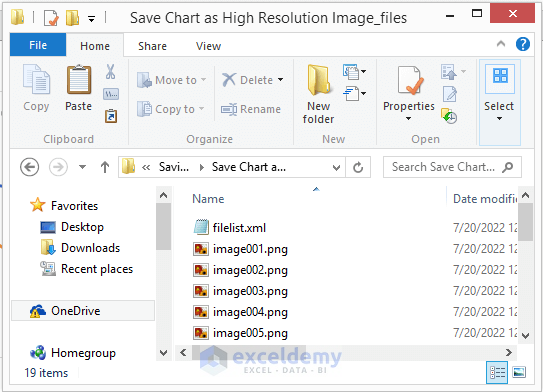
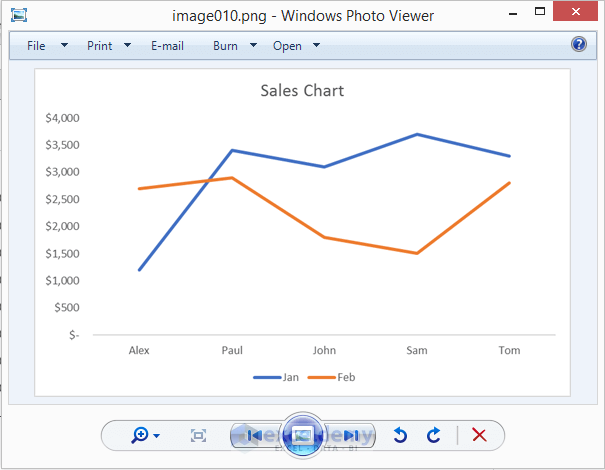
In our case, image010 contains the chart.
Method 6 – Using VBA
We can also write and run a VBA code to save an Excel chart as a high resolution image.
Steps:
- Click on the chart and note its name.
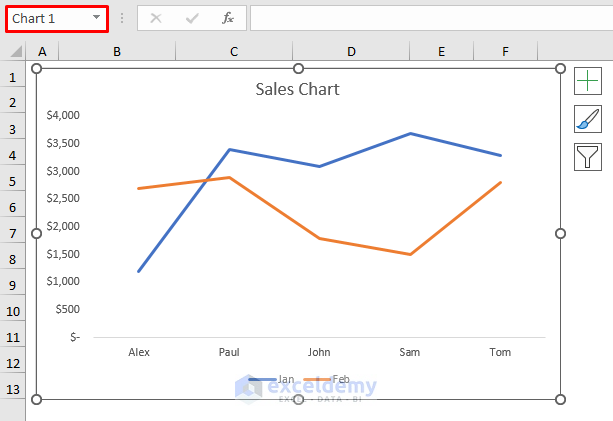
- Go to the Developer tab and select Visual Basic.

- In the Visual Basic window that opens, select Insert and then select Module.
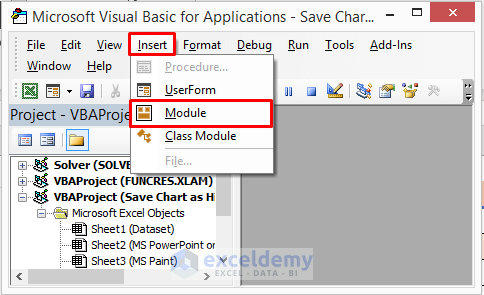
- Enter the following code in the Module window that opens:
Sub Save_Chart_as_Image()
Dim FName As String
Dim SChart As ChartObject
Dim oHeight As Integer, oWidth As Integer
Set SChart = Sheets("VBA").ChartObjects("Chart 1")
oHeight = SChart.Height
oWidth = SChart.Width
SChart.Height = 500
SChart.Width = 500
FName = ThisWorkbook.Path & "\" & SChart.Name & ".png"
SChart.Chart.Export FName
SChart.Height = oHeight
SChart.Width = oWidth
End Sub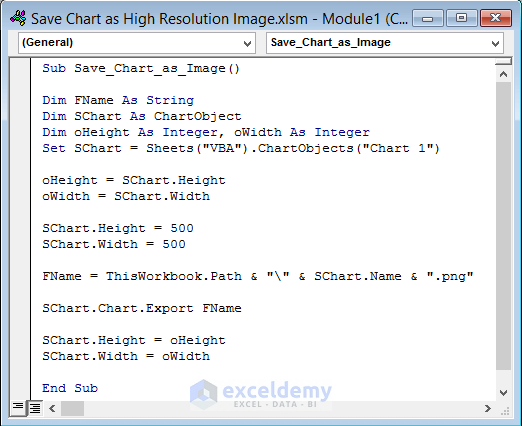
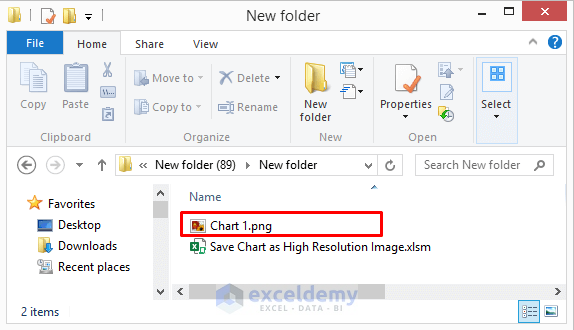
This code will save the chart in the folder where the Excel file is already saved. We used the sheet name and chart name inside the Set SChart = Sheets(“VBA”).ChartObjects(“Chart 1”) command. In our case, the sheet name is VBA, and the chart name is Chart 1. To save the chart as a jpeg file instead, type .jpeg in place of .png inside the code.
- Press Ctrl + S to save the code.
- Go to the Developer tab and select Macros.

- In the Macro window that opens, select the code and Run it.
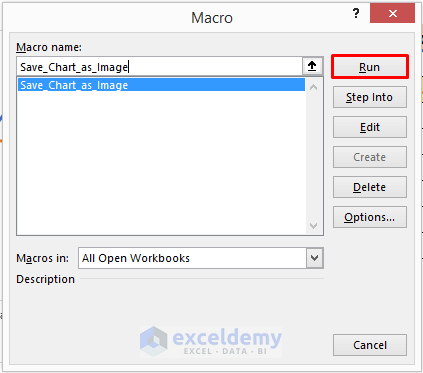
- Go to the location where the Excel file is saved and you will find the chart saved as a high resolution image.
Download Practice Book
Related Articles
<< Go Back to Save Excel as Image | Export Data from Excel | Learn Excel


