
Excel with Python opens up powerful data manipulation, automation, and analysis possibilities. It allows users to perform complex tasks more efficiently and handles large and complex datasets for data analysis. Recently Microsoft 365 offered Python integration in Excel allowing users to go beyond basic data manipulation, unlocking advanced analysis, visualization, and automation capabilities. This tutorial will show how you can supercharge Excel with Python within Excel and via traditional external libraries.
Using Excel with Python in Jupyter Notebook
Let’s consider a sales dataset of supermarkets to explore the use of Python with Excel.
Calculate the Total and Average with Python
You can perform common data analysis operations like sum, and average by using Python’s Pandas library to gain insights from large datasets. It performs these operations programmatically, making it easier to manipulate large datasets with just a few lines of code. Let’s show you how you can do this within Excel and in a Jupyter Notebook.
import pandas as pd
# Read the data
df = pd.read_excel('Supermarket-Sales-Data.xlsx')
# Calculate total and average sales amount
total_sales = df['Sales Amount'].sum()
average_sales = df['Sales Amount'].mean()
print(f"Total Sales: {total_sales}, Average Sales: {average_sales}")

#Output:
#Total Sales: 9868.319999999998, Average Sales: 140.97599999999986
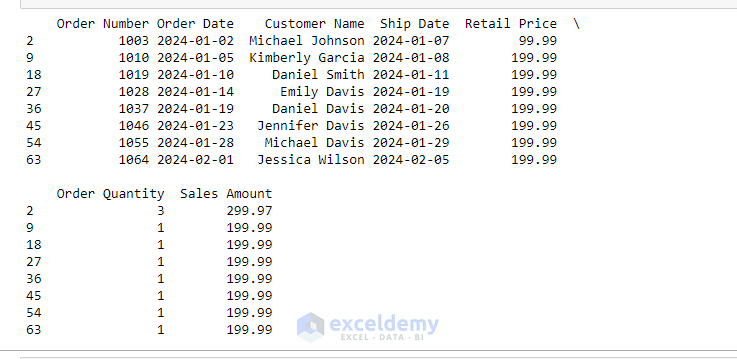
Filtering Sales Data by Sales Amount
You can filter the data based on a specific period, such as viewing orders made after a particular date. This can be done manually using Excel’s filtering feature, but with Python, it becomes more efficient, especially for larger datasets.
import pandas as pd
# Read the data
df = pd.read_excel('Supermarket-Sales-Data.xlsx')
# Filter sales based on sales amount
filtered_df = df[df['Sales Amount'] > 180]
print(filtered_df)
Data Analysis with Pandas
Python pandas library is one of the most widely used libraries for data analysis. It helps to work with large datasets, performs statistical operations, handles missing data, etc. The .describe() property will show the statistical summary.
import pandas as pd
# Read Excel data
df = pd.read_excel('Supermarket-Sales-Data.xlsx')
# Perform analysis
summary = df.describe()  # Get summary statistics
print(summary)
Output:
          Order ID  Retail Price  Order Quantity  Sales Amount
 count    70.000000     70.000000       70.000000     70.000000
 mean   1035.500000     84.418571        2.400000    140.976000
 std      20.351085     57.043988        1.334058     38.944251
 min    1001.000000     19.990000        1.000000     29.990000
 25%    1018.250000     39.990000        1.000000    122.475000
 50%    1035.500000     69.990000        2.000000    149.950000
 75%    1052.750000    129.990000        3.000000    149.990000
 max    1070.000000    199.990000        5.000000    299.970000
It can also convert Excel formulas and allow more advanced data transformations using Python’s vast ecosystem of libraries.
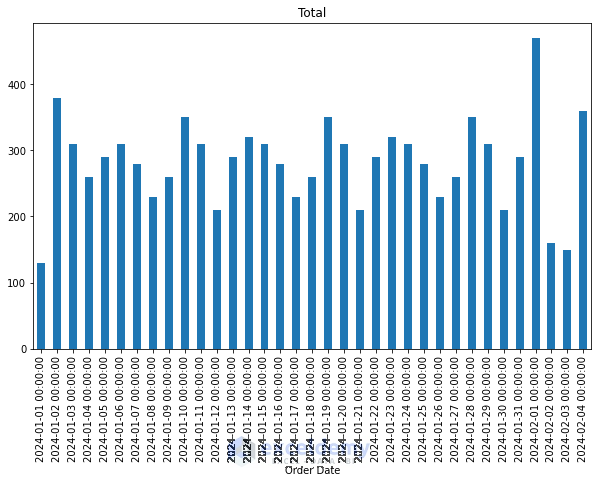
Create Visualizations with Python
Though Excel has robust charting tools, Python provides libraries like matplotlib, seaborn, and plotly which take visualizations to the next level. They offer more customization options and can handle larger datasets.
import pandas as pd
import matplotlib.pyplot as plt
# Read the data
df = pd.read_excel('Supermarket-Sales-Data.xlsx')
# Group by Order Date and sum Sales Amount
grouped_data = df.groupby('Order Date')['Sales Amount'].sum()
# Plotting
plt.figure(figsize=(10, 6))
grouped_data.plot(kind='bar')
plt.title('Total')

# Output:
# Text(0.5, 1.0, 'Total')
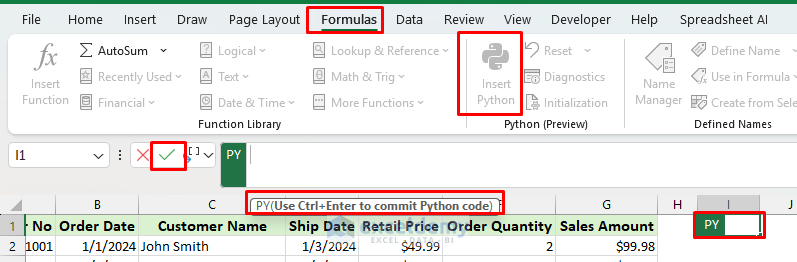
Using Python in Excel Environment
In Microsoft 365 with an internet connection, you can use Python within the Excel environment. Let’s perform data analysis of supermarket sales data in Excel with Python.
Let’s show you the step-by-step procedure to do so.
Steps:
- Select any cell >> go to the Formulas tab >> select Python.
- Insert Python script in the formula bar.
- Press CTRL+ENTER or the click on Tick (✓) mark on the formula bar.
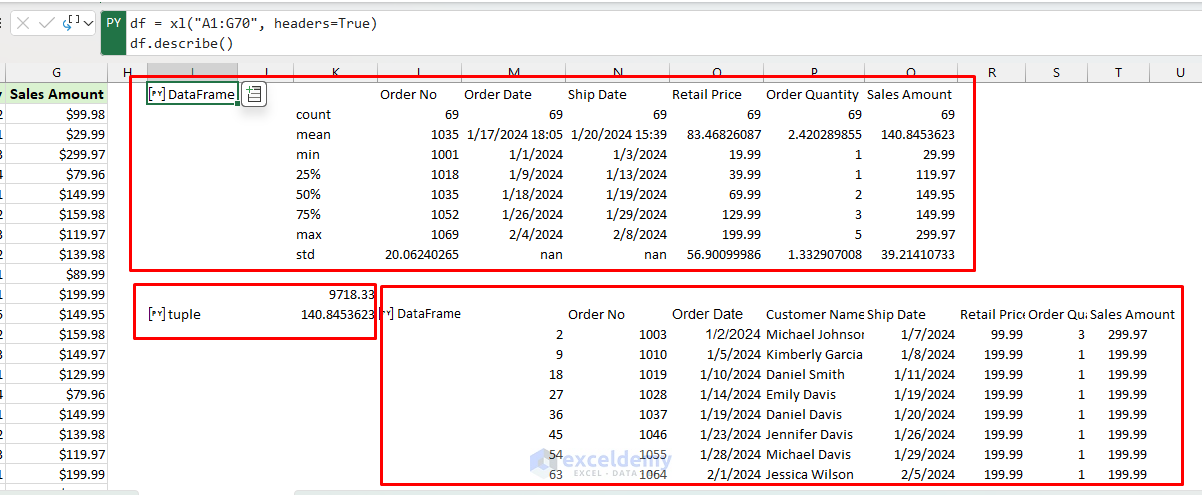
Data Analysis of Sales Data
Insert the following Python code in the I1 cell to get the statistical summary of the sales data.
df = xl("A1:G70", headers=True)
df.describe()
Calculate the Total and Average Sales Amount
Insert the following Python code in the I12 cell to calculate the total and average sales.
df = xl("A1:G71", headers=True)
total_sales = df["Sales Amount"].sum()
average_sales = df["Sales Amount"].mean()
(total_sales, average_sales)
Filtering Sales Data by Sales Amount
Insert the following Python code in the L12 cell to filter data where the sales amount is greater than 180.
df = xl("A1:G70", headers=True)
df = df[df['Sales Amount'] > 180]
Output:
Here is the output of three examples.
Conclusion
By supercharging Excel with Python, you can perform complex tasks and advance data analysis. Either automating tasks, handling large datasets, performing advanced analysis, or creating dynamic visualizations, Python empowers you to achieve more in less time. Excel’s integrated Python performs similar tasks to external Python. These examples illustrate the power of using Python for data analysis, both inside Excel and in a Jupyter Notebook.
Get FREE Advanced Excel Exercises with Solutions!

HI
Hello Jeremy Brundrett,
Hope you are doing well. Feel free to post any queries regarding Excel or this article. We are here to help you. Keep learning Excel with ExcelDemy!
Regards
ExcelDemy