What Is Excel?
Excel is a software program from Microsoft that is part of the Microsoft Office suite of productivity software. Excel is used to create spreadsheets, which are documents with rows and columns of cells that can contain text, numbers, or formulas. Spreadsheets are often used to store data, but they can also be used to perform calculations. That is why Excel is used very highly in the workplace.
For example, a spreadsheet could be used to calculate a person’s monthly budget or to track a company’s sales figures. Excel is a powerful tool that can be used for a variety of purposes. It is important to remember that spreadsheets are only as accurate as the data that is entered into them.
A List of Professional Workplaces Where Excel Is Used
Example 1 – Administrative Functions
In addition to creating graphs and charts, Excel can store and edit data.
Inventory levels, budget expenditures, and employee performance may all be tracked using Excel. Additionally, it can be used to make reports and presentations. This is due to plenty of features that support tables and dynamic calculations.
Example 2 – Storing Verifying Data in Business
Excel is perfect for entering, analyzing, and calculating company data. Excel offers different types of charts, which are helpful to make statistical models for business purposes. Excel can store text-based data like mailing lists, client lists, and employee data.
Example 3 – Tracking Numbers
Every business house generates huge numbers every day. Business houses need budgets, they calculate their day to day expenses. All can be done with Excel. Every kind of financial calculation can be done with Excel. Say a newspaper will publish a survey on some topics. They can use Excel. Where there is a number, there is Excel.
Example 4 – Creating Charts
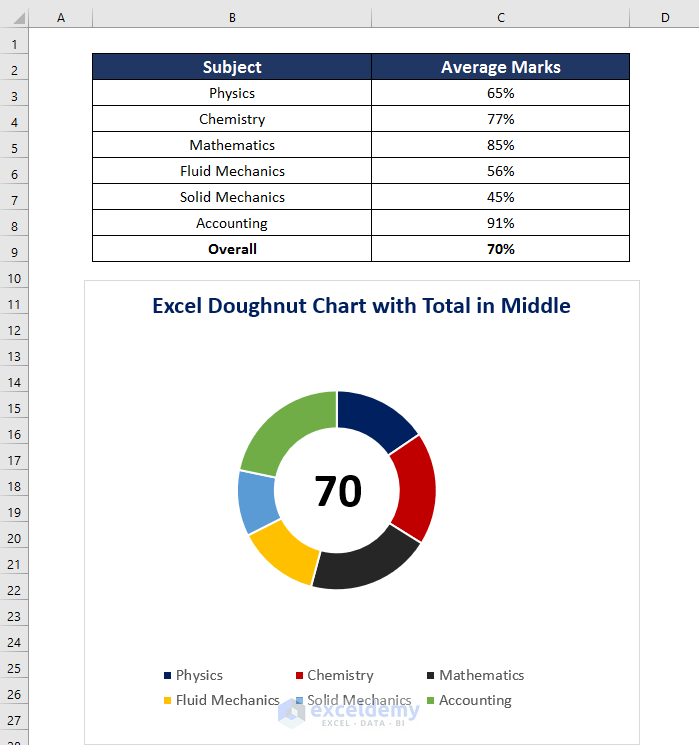
Excel is a popular program used for creating graphs. Graphs provide a visual representation of data, which can be helpful in understanding trends and patterns. Excel offers a variety of graph types, including bar graphs, line graphs, pie charts, and doughnut charts. Excel is used frequently in the workplace for this purpose.
Example 5 – Reporting and Visualizations
Excel is an effective tool for reporting and data analysis. You may quickly make customized reports and visualizations using its built-in capabilities to better comprehend your data.
Excel is a terrific tool for making reports and visualizations, whether you’re a business owner, data analyst, or just someone who wants to understand their data better. You may produce personalized reports and visualizations using its simple features to help you understand your data.
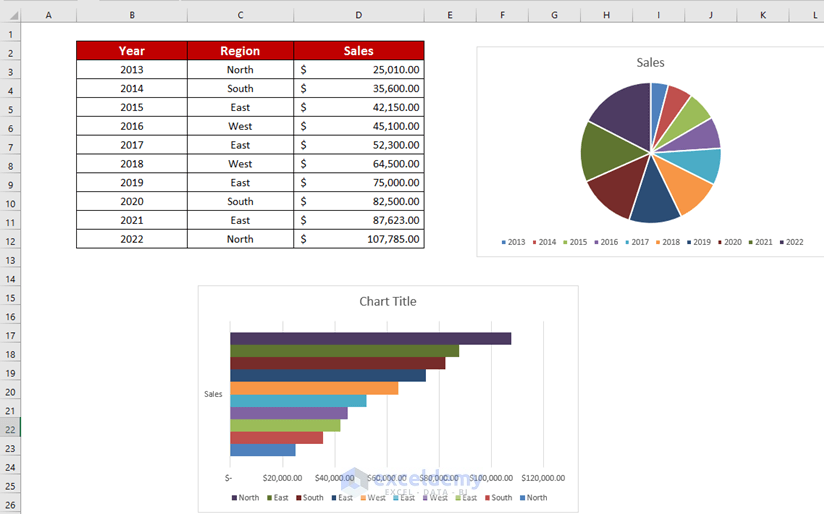
We can visualize the same dataset in different ways.
Example 6 – Research
Research is an important part of a business organization to develop its business model. A “What-if” analysis is ideal for this section. Excel comes with three types of What-if analysis tools, which make work easier.
Example 7 – Work Scheduling
Managers can track employees working hours by using Excel spreadsheets. Managers can make a perfect working schedule for the employees and manage their working hours very easily. The manager can also edit employees’ schedules for their needs.
Example 8 – Basic Financial Accounting
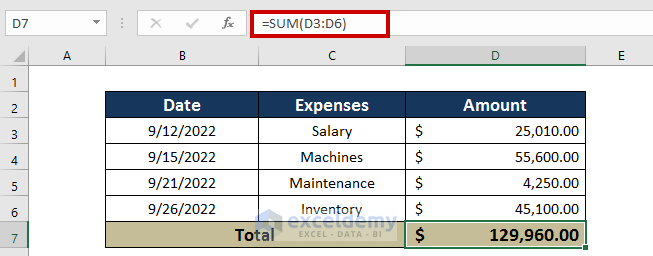
Generally, an Excel spreadsheet is used in both small and mid-level business organizations for their accounting activity. Excel is ideal for monitoring a company’s financials. By using data entry tools, we can manage inventory, record expenses, and income, and track our budget.
Example 9 – Business Data Analysis
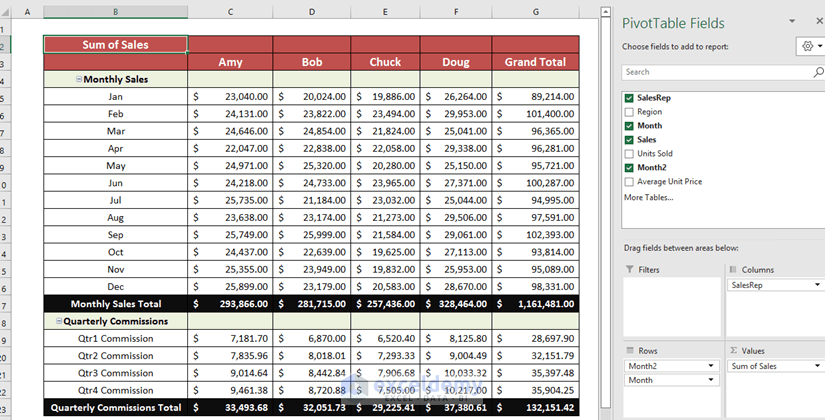
By using a PivotTable, you can get insight from a large pile of data. You can easily change your data table to display your desired data field by using filters or swapping tools.
Example 10 – Tracking Product Sales
Sales data is critical for any business. You need to track not only how many sales you’re making, but also what products are selling well and which ones aren’t. This information helps you make decisions about what products to stock, how to price them, and where to focus your marketing efforts. Track the sales amounts daily, weekly, monthly, or yearly. You can easily forecast the condition of sales next year.
Example 11 – Customer Data
By using Excel, companies can make a full-fledged customer database to monitor their business condition. Depending on the customer demands in the market, they can take essential steps to take their company forward.
Example 12 – Budget Making
By using built-in Excel formulas and calculating features company can make their budget very easily. They can merge data from different worksheets and analyze them to have an improved budget quite easily. They can even compare their budgets with graphical representation.
Example 13 – Forecasting
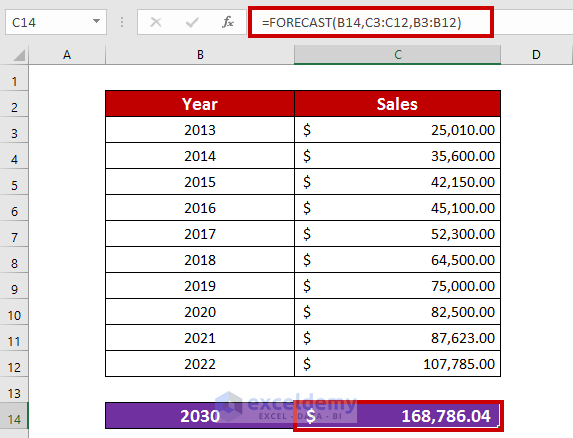
In order to predict future sales, trends, or other data, Excel is a great tool for forecasting. Excel has some third-party software that is used for financial projection by analyzing previous data.
Which Professionals Need to Use Excel on a Regular Basis?
1 – Financial Analysts
Generally, financial analysts make a conclusion on the basis of financial data. Excel is a great tool to analyze financial data. So, they must have great knowledge of Excel.
2 – Office Clerks, Administrative Assistants, Information Staff
Office clerks and Information staffs need Excel spreadsheet experience for the collection of data. For creating reports, organizing documents, and scheduling appointments, administrative assistants must have a great knowledge of Excel.
3 – Retail Store Managers
Generally, a store manager who is monitoring inventories, overseeing and leading staff, and making policies for the company should have a great knowledge of Excel.
4 – Project Managers
A project manager makes a project plan on basis of project data. So, knowledge about Excel must be needed.
5 – Business Analysts
A business analyst analyzes and assesses a business to identify the maximum profit solutions of a company by tracking a large pile of data.
6 – Digital Marketers
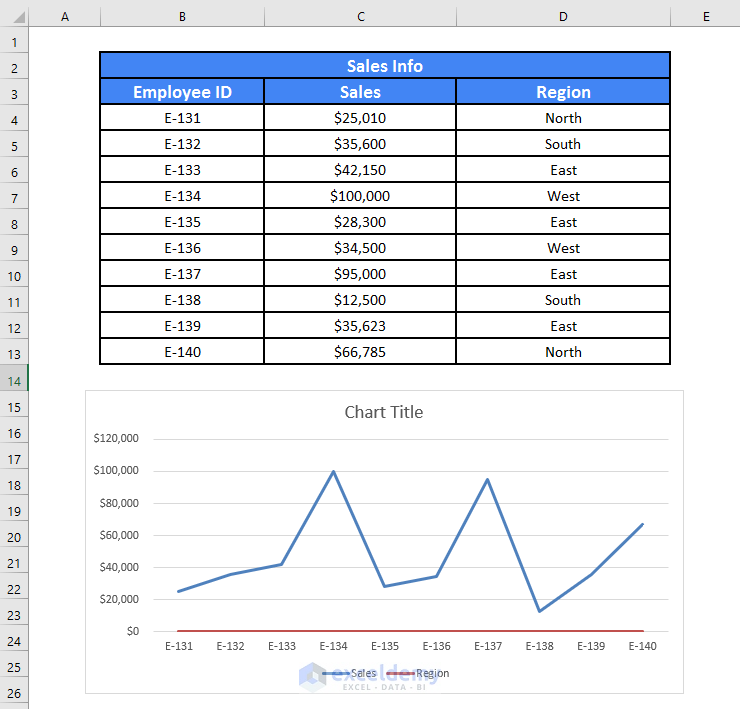
Digital Marketers always seek new market opportunities. They use Excel graphs, charts, and other data visualization tools.
7 – Data Journalists
Nowadays, data journalists work with a large amount of data. That’s why they should have great skills in Excel.
8 – Administrative, Marketing, Training, and Sales Managers
Sales and marketing managers always involve in numbers. Administration and training managers involve in organizing, planning, and scheduling different resources and items.
9 – Remote Excel Jobs
We can work remotely with different companies all over the world based on the knowledge of Excel. The program can also share files or provide collaboration tools.
10 – Auditors and Accountants
Auditors and accountants involve in financial documents and statements. So, they must have a great knowledge of Excel to decorate their documents and statements.
11 – Cost Estimators
Cost estimators work with project managers and engineers to determine the moderate amount of money, labor, and time which is needed for the project.
What Are the Necessary Excel Skills for Being Highly Competitive in the Job Fields?
- Skills of Advanced Excel Functions
- The arrangement of diverse functions
- Sorting of statistics and related entries
- Applying for proper Data validation
- Familiarity with macros and VBA
- Protecting sheets and locking of cells
- Provision of numerical breakdown
- Familiarity with the control panel
- Proper formatting of data
- Facts about basic calculations and formulas for Excel
- Functional formatting options to display
- Familiarity with other allied functions
Read More: Basic Terminologies of Microsoft Excel


