Charting challenge

want2learn

New member
Firstly i'd like to thank Instructor: Shahriar Abrar Rafid & Editor: Md. Riajul Islam for this clip.
I have worked my way through this and feel I have done it all correctly. However, the chart is not displaying as I had hoped.
In the clip the chart appears as
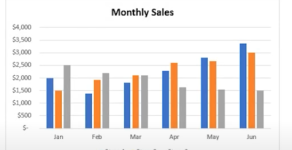
1735358280853.png

Mine however appears with only one x axis category and looks like
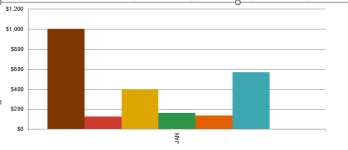
1735358315852.png
I am wanting to compare the individual monthly totals against the year to date total as a monthly representation. (this view can be changed in the table)
I would like to see in each column on the graph, the budget amount followed by each of the 12 months.

My dream is that I can select and display the individual month against the budget, however I'm not that gifted with excel. My head is spinning with my learnings today.

I have attached the file, all data is just numbers entered for trialling purposes.
Expertise would be much appreciated
TIA
 

Attachments

Hello want2learn,

I understand you're aiming to create a chart in Excel that compares individual monthly totals against the year-to-date (YTD) total for each month. Let's work through this step by step to achieve your desired outcome.

1. Organize Your Data:

Ensure your data is structured appropriately. You should have columns for:
  • Month: List each month (e.g., January, February, etc.).
  • Monthly Total: The total for each individual month.
  • YTD Total: The cumulative total up to and including that month.
2. Calculate the YTD Total:

In Excel, you can calculate the YTD total using a cumulative sum formula. For example, if your monthly totals are in column B, starting from row 2, you can enter the following formula in cell C2 for the YTD total:

=SUM($B$2:B2)

Drag this formula down column C to apply it to all months. This formula adds up all monthly totals from the first month to the current month, giving you the cumulative total.

3. Create the Chart:
  • Select Your Data: Highlight the columns for Month, Monthly Total, and YTD Total.
  • Insert Chart: Go to the 'Insert' tab and choose a suitable chart type. A Clustered Column Chart is effective for comparing monthly totals against YTD totals side by side.
 
Thankyou Shamima,
I am understanding what you say about accumulative totals for the month, howeverver I would like the bills to remain separate to each other.

Are my data points in the original spreadsheet not correct?

This is the sheet I have modelled my budget from, https://files.moneysmart.gov.au/media/vxudqwql/budget-planner_moneysmart.xls and you can see that it has the cost areas separated (how I'd like it) and in my sheet, I have added the monthly totals for each cost area of bills in the table AN18:AU30. It is the totals of each cost area that I am wanting represent in the graph .

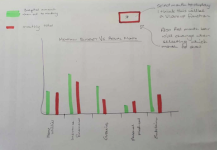
I have drawn an example of how I feel the graph will look when complete and what it is comparing.
1735607366347.png
Some notes:
* Green is the budgeted amount taken from each cost area in column G
* Red is the Actual monthly totals for each cost area taken from each row in table AN18:AU30
* The red box in the drawing I will need to add so that I can change the month to represent actual costs vs budget
Thanks again and merry Christmas & Happy new year for whenever you get this ;)
 
Hello,

Thank you for clarifying! I now understand that you'd like to maintain the separation of cost areas in your graph, similar to the example provided in the Moneysmart budget planner. You also want the chart to reflect the monthly totals for each cost area from the table AN18:AU30.

Here’s how you can proceed:

Prepare Your Data for Charting:
  • Ensure your table AN18:AU30 includes columns for:
  • Cost Areas (e.g., Home Utilities, Groceries, etc.).
  • Monthly Totals for each cost area.
  • YTD Budgeted Amounts, if applicable.
Set Up a Dynamic Chart:
  • Highlight the columns for Cost Areas, Monthly Totals, and Optionally Budgeted Amount YTD.
  • Insert a Clustered Column Chart from the Insert tab.
 

Online statistics

Members online
0
Guests online
8
Total visitors
8

Forum statistics

Threads
386
Messages
1,693
Members
736
Latest member
ABDULLAH07
Back
Top