want2learn
New member
Firstly i'd like to thank Instructor: Shahriar Abrar Rafid & Editor: Md. Riajul Islam for this clip.
I have worked my way through this and feel I have done it all correctly. However, the chart is not displaying as I had hoped.
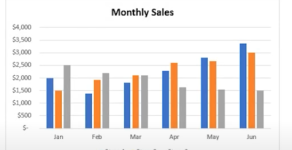
In the clip the chart appears as

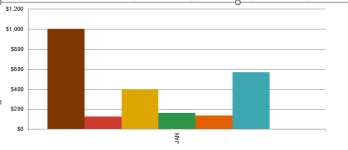
Mine however appears with only one x axis category and looks like

I am wanting to compare the individual monthly totals against the year to date total as a monthly representation. (this view can be changed in the table)
I would like to see in each column on the graph, the budget amount followed by each of the 12 months.
My dream is that I can select and display the individual month against the budget, however I'm not that gifted with excel. My head is spinning with my learnings today.
I have attached the file, all data is just numbers entered for trialling purposes.
Expertise would be much appreciated
TIA
In the clip the chart appears as

Mine however appears with only one x axis category and looks like

I am wanting to compare the individual monthly totals against the year to date total as a monthly representation. (this view can be changed in the table)
I would like to see in each column on the graph, the budget amount followed by each of the 12 months.
My dream is that I can select and display the individual month against the budget, however I'm not that gifted with excel. My head is spinning with my learnings today.
I have attached the file, all data is just numbers entered for trialling purposes.
Expertise would be much appreciated
TIA

