To create an organized and informative report, you can follow these steps:
Step 1: Create a summary sheet that shows the following details for executive and non-executive employees:
The number of employees in each category
The minimum, maximum, and average basic salary for each category
The minimum, maximum, and average overtime amount for each category
The minimum, maximum, and average total salary for each category
Step 2: Create a pivot table that compares the salary details of each category. You can include the following columns:
Category (Executive or Non-executive)
Basic Salary (Minimum, Maximum, and Average)
Overtime Amount (Minimum, Maximum, and Average)
Total Salary (Minimum, Maximum, and Average)
Step 3: To compare the recommended allowance amount with that of competitors, you can create a separate table that shows the recommended allowance for executive employees and the average allowance offered by competitors. You can also include a column that calculates the difference between the recommended allowance and the average allowance offered by competitors.
To give the details of the recommended allowance for executive employees when comparing non-executive employees, you can create a separate table that shows the recommended allowance for each category and the difference between the two.
Make sure to include relevant charts and graphs to visualize the data and highlight key findings.
[
Note: It's difficult to recommend a specific allowance amount without knowing more about your company and industry. However, you can compare your allowance amount to that of your competitors to get an idea of how competitive your compensation package is. If your allowance amount is lower than that of your competitors, you may want to consider increasing it to attract and retain top talent.]
Your question: I need to summary sheet of salary details with executive & non executive category employees obtain and what Maximum Overtime amount to give each category.
Answer:
You must follow the steps below to create a summary sheet of salary information with executive and nonexecutive category employees and a maximum overtime amount corresponding to each category.
- Click on any cell in the data ⇒ go to the Insert tab.
- Click on the PivotTable button ⇒ Select New Worksheet or Existing Worksheet radio button.
- Press OK ⇒ Drag and drop the fields.
- After pressing OK, a new sheet appears to the left of the current sheet. If you go to this sheet, you will see that the sheet looks like the following image.
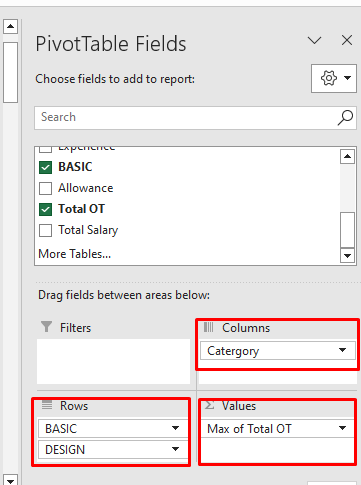
- We have to select or drag the Category and Basic and Design field to the Row area first, then we will select or drag the Total OT fields one after another.
- Consequently, you will get the following Sum of the Total OT table, Now we want to get the maximum overtime amount corresponding to each category.
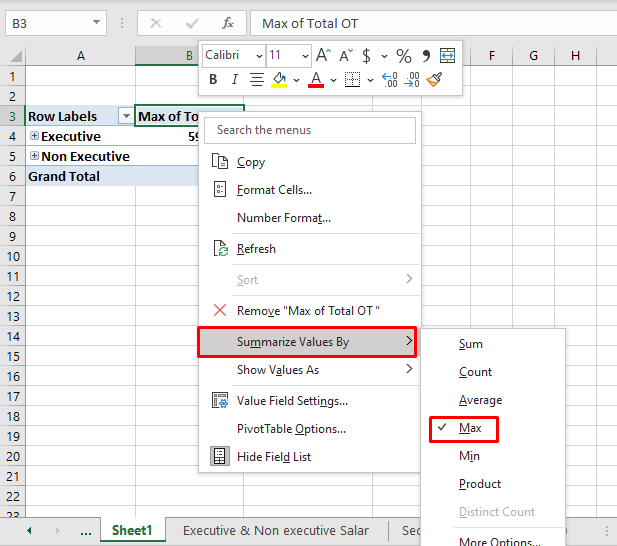
- Next, click any cell on the pivot table and right click on it and select Summarize Values By And click on the Max option.
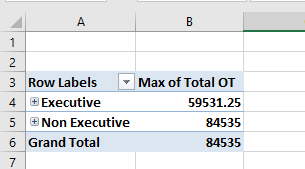
- Therefore, you will get a summary sheet of salary information with executive and nonexecutive category employees and a maximum overtime amount corresponding to each category.
- If you want to know all the data click on the +icon of Executive and Non-Executive Labels.
- Therefore, you will following details of the maximum overtime amount corresponding to each category.
- If you want to customize your table based on your report purpose, you can select and drag Category into the Columns field.
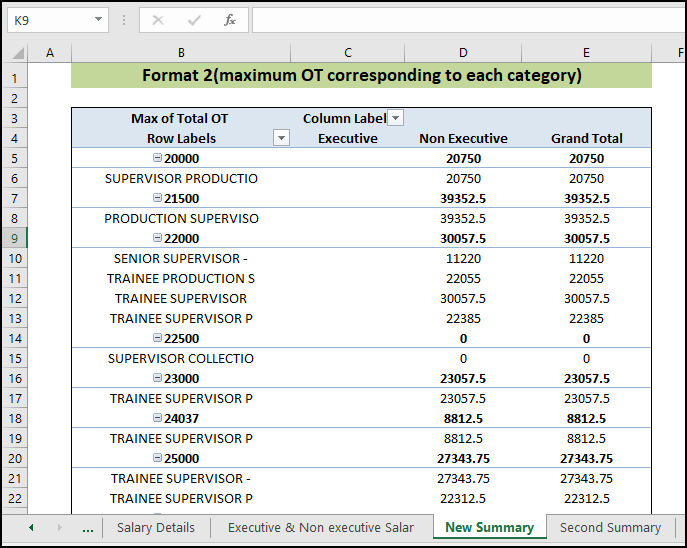
- Finally, you will get a summary sheet of salary information with executive and nonexecutive category employees and a maximum overtime amount corresponding to each category.
Your Question:
2. Salary comparison of the each category, basic salary , total OT amount , total salary.
How can I show this in the pivot table?
Solution:
To get a summary of the salary comparison of each category, basic salary, total OT amount, and total salary, you need to follow the below steps.
- Click on any cell in the data ⇒ go to the Insert tab.
- Click on the PivotTable button ⇒ Select New Worksheet or Existing Worksheet radio button.
- Press OK ⇒ Drag and drop the fields.
- After pressing OK, a new sheet appears to the left of the current sheet. If you go to this sheet, you will see that the sheet looks like the following image.
- We have to select or drag the following field to the Row area first, then we will select or drag the other fields one after another.
- Therefore, you will get a summary of the Salary comparison of each category, basic salary, total OT amount, and total salary
I am also attaching the Excel Workbook below.