[Solved] Make bar chart dynamically in vb code with differnt color code based on values

Hello

I need to make a bar chart,

A. B

Prod1. 100. 25

Prod2. 100. 75


Critera.

1. When value in column B is grater than 90, colour should be green.

2. When value in column B is between 50- 90, colour should be Yellow.

3. When value in column B is less than 50, colour should be Red.


How i can make it, i tried with overlap option found on internet but could not succeed.


Kindly guide

Regards,
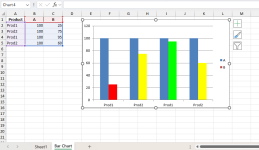
Hello Faisal,

I used VBA code to create a color-coded bar chart based on different criteria.

Bar Chart.png

Copy and paste the following VBA code:

Code:
Sub CreateChartWithConditionalFormatting()
    Dim ws As Worksheet
    Set ws = ThisWorkbook.Sheets("Bar Chart") ' Adjust if your sheet name is different
  
    ' Create the chart
    Dim chartObj As ChartObject
    Set chartObj = ws.ChartObjects.Add(Left:=100, Width:=375, Top:=50, Height:=225)
    With chartObj.Chart
        .SetSourceData Source:=ws.Range("A1:C5")
        .ChartType = xlColumnClustered
    End With
  
    ' Apply conditional formatting
    Dim series As series
    Set series = chartObj.Chart.SeriesCollection(2) ' Series 2 corresponds to column B
  
    Dim point As point
    For i = 1 To series.Points.Count
        Set point = series.Points(i)
        Select Case ws.Cells(i + 1, 3).Value ' B values are in the third column
            Case Is > 90
                point.Format.Fill.ForeColor.RGB = RGB(0, 255, 0) ' Green
            Case Is >= 50
                point.Format.Fill.ForeColor.RGB = RGB(255, 255, 0) ' Yellow
            Case Else
                point.Format.Fill.ForeColor.RGB = RGB(255, 0, 0) ' Red
        End Select
    Next i
End Sub

Download the Excel File:
 

Attachments

thanks for your reply. This is not possible without VB programming?

regards,

Thanks for your appreciation. We can't apply conditional formatting directly to charts in Excel because the software is designed to handle data formatting and chart visualization separately. Microsoft Office removed its conditional formatting options from charts so it's not possible to do it dynamically in charts.

But you can change the Bar color manually using Format Data Series. In Sheet 1 I changed the bar colors manually based on the conditions.

Therefore, only VBA is available to apply coloring based on the Bar chart based on conditions.
 

Online statistics

Members online
1
Guests online
8
Total visitors
9

Forum statistics

Threads
371
Messages
1,627
Members
705
Latest member
curioso
Back
Top