Hi,
I've been trying to work this thing out.
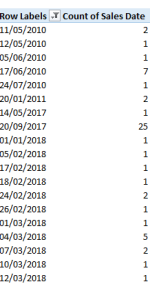
I do not know what I've been doing wrong. I am trying to create a pivot table to show a monthly sales report. I wanted to show the figures monthly but the dates aren't cooperating with me. I've already checked the date format it is okay. Whenever I use the filter, it comes up as grouped into dates and even years. But when I create a pivot the dates are appearing individually and I am unable to group them at all.
This is how it appears on my source data.

and when I create a pivot it turns into this.

Please help me
I've been trying to work this thing out.
I do not know what I've been doing wrong. I am trying to create a pivot table to show a monthly sales report. I wanted to show the figures monthly but the dates aren't cooperating with me. I've already checked the date format it is okay. Whenever I use the filter, it comes up as grouped into dates and even years. But when I create a pivot the dates are appearing individually and I am unable to group them at all.
This is how it appears on my source data.

and when I create a pivot it turns into this.

Please help me
