[Solved] Why my bell graph is floating?

cljavier

New member
Hello Teachers,

Good day. I saw your video online about "How to Create Skewed Bell Curve in Excel" and found it very informative. However, I am troubled with the given data my professor tasked me to do. This is our Midterm project in Intro to Analytics and I couldn't figure out if my graph is acceptable or if there is something wrong with my calculation. I hope you see my message. Thank you and God bless.
 

Attachments

Hello Teachers,

Good day. I saw your video online about "How to Create Skewed Bell Curve in Excel" and found it very informative. However, I am troubled with the given data my professor tasked me to do. This is our Midterm project in Intro to Analytics and I couldn't figure out if my graph is acceptable or if there is something wrong with my calculation. I hope you see my message. Thank you and God bless.
Hello Cljavier

Welcome to ExcelDemy Forum! Thanks for reaching out and sharing your queries.

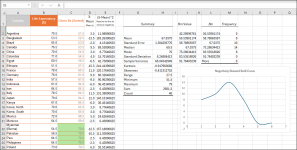
We have reviewed your work and the dataset and found that the data you provided depicts a negatively skewed distribution, not a positively skewed one. The skewness value signifies a negative skew, in this case, -0.411312752. Again, if Mean < Median < Mode satisfies, we can say that the distribution is negatively distributed; in this case, 67.0375 < 69.5 < 70.

1711601774272.png

In a negatively skewed distribution, the tail extends towards the left side. In other words, a negatively skewed bell curve has a long tail pointing towards the left.

Your calculations seem correct. In my view, your graph with a negative skew is an acceptable representation of the life expectancy data.

I am attaching the workbook used to investigate your work; good luck.

Regards
Lutfor Rahman Shimanto
ExcelDemy
 

Attachments

Online statistics

Members online
0
Guests online
5
Total visitors
5

Forum statistics

Threads
381
Messages
1,672
Members
721
Latest member
Dzaki wafi
Back
Top